Figure 7.
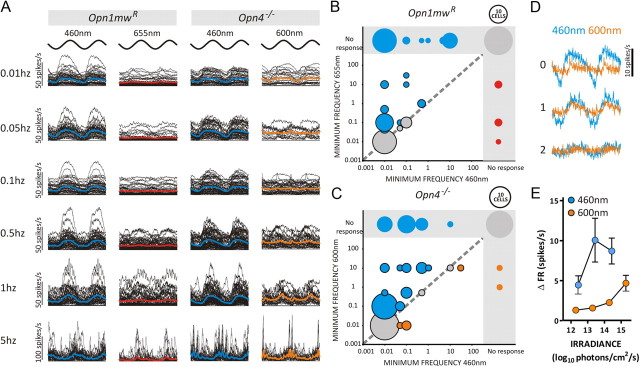
Wavelength-dependent temporal frequency tuning within the PON. A, Traces of the change in firing (with respect to baseline) elicited by sinusoidal modulations in light intensity over a range of frequencies rendered in either a short (460 nm) or longer (655/600 nm) wavelength for individual Opn1mwR and Opn4−/− cells. The stimulus is shown above for phase information. Solid blue/red/orange lines depict the mean response for each condition. Only cells showing a significant change in firing rate (χ2 periodogram, p < 0.001) in that condition were included. Peak-to-trough irradiance was set at 13.2 to 14.2 LWS/MWS opsin-effective photons/cm2/s under all conditions. The enhanced ability to track low-frequency oscillations at 460 nm was also evident in plots (B, C) depicting the minimum frequency at which significant responses were observed at each wavelength in Opn1mwR (B) and Opn4−/− (C) mice. Circled area is scaled to represent number of cells in each group (circle size for 10 cells shown above each graph for comparison) and color coded such that blue represents cells showing a lower-threshold frequency at 460 than 655/600 nm, red/orange cells for which the converse was true, and gray cells whose threshold frequency was the same at both wavelengths. Cells showing no significant response to either or both wavelengths are found in the gray shaded area of each graph. The spectral sensitivity of high-amplitude responses at lower frequencies was consistent with an S-cone origin. Thus, plots of either average response profile (D) or response amplitude (E; peak-to-trough change in firing) in Opn4−/− mice exposed to 0.1 Hz sinusoids of equivalent contrast (10× increase MWS-effective irradiance from trough-to-peak) revealed large responses at 460 but not 600 nm and only at higher mid-point irradiances (shown as figures reporting log10 proportion of the brightest condition in D and in total photon flux for E). n = 52 cells from 6 Opn1mwR and n = 48 cells from 7 Opn4−/− animals.

