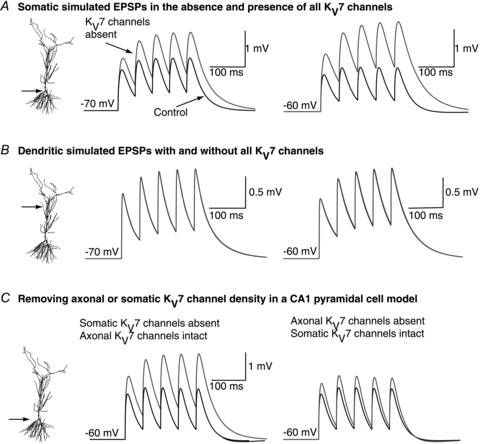
Figure 3. Twenty hertz trains of EPSPs obtained using computer simulations with (black) and without (red) KV7/M-channels at the soma (A) and dendrites (B).

The simulations were obtained at −70 mV and −60 mV. C, computer simulations showing 20 Hz αEPSP traces under control (black) conditions and following the selective removal of either somatic or axonal KV7/M-channel density (grey). The simulations were performed at −60 mV. The scale bar shown applies to both traces.
