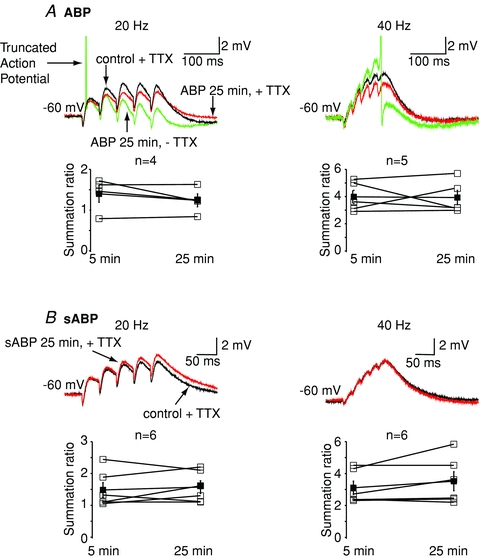
Figure 5. Axonal KV7 channels have little effect on somatic αEPSP summation.

A, example traces showing the effects of including the ankyrin G binding peptide (ABP, 10 mm) in the intracellular pipette solution on 20 Hz and 40 Hz trains of αEPSPs. The traces within 5 min of going whole cell are deemed control (see (Shah et al. 2008) and are in black. The maximal effect of ABP occurs within 25 min (Shah et al. 2008) and is shown in red. TTX was present throughout. Washout of TTX resulted in spikes (AP; green trace). Generation of spikes will cause an afterdepolarization and/or afterhyperpolarization, which will affect αEPSP summation. Indeed, in the particular example shown, the action potential resulted in an afterdepolarization followed by an afterhyperpolarization, thereby distorting the αEPSP summation. For this reason, αEPSP summation ratios were calculated from traces in the which TTX was present in the external solution. The average (mean and SEM; filled squares) and individual (open squares) calculated summation ratios following 5 min and 25 min of patching with pipettes containing ABP in the presence of external TTX are shown below the traces. B, representative traces showing the effects of scrambled ABP (sABP, 10 mm) on 20 Hz and 40 Hz trains of αEPSPs within 5 min of going whole cell (control, black) or after 25 min (red). All experiments were performed in the presence of TTX. The individual (open squares) and mean (filled squares) calculated summation ratios for all cells in which sABP was included in the pipette are shown below.
