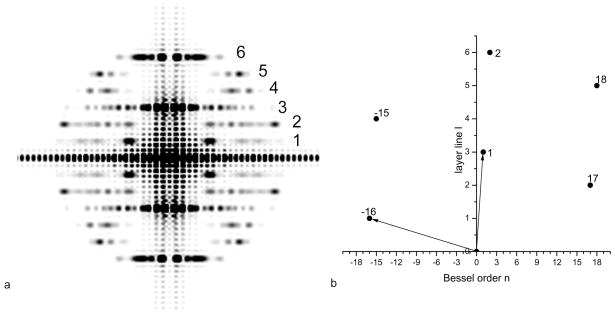
Fig. 7.
The averaged power spectrum (a) from the 120 px (240 Å) long projections of the TMV model in Fig. 6a. The layer lines are numbered 1–6, where layer line 3 is at a spacing of 1/(23 Å) and arises from the 23 Å pitch 1-start helix of TMV. The n,l plot for TMV (b) shows that layer line 1 contains n=−16, layer line 2 contains n=17, etc.

