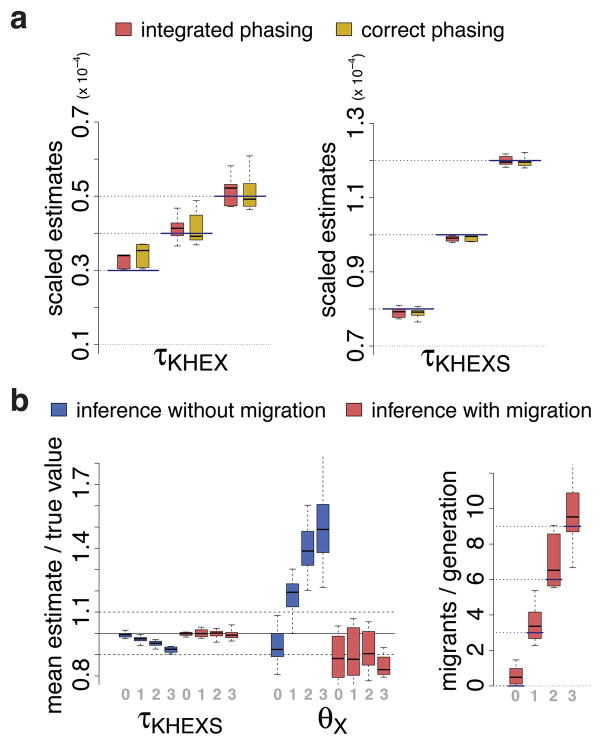
Fig. 2. Results of simulation study.
Simulations assumed a population tree like the one shown in Fig. 1 and plausible divergence times, population sizes, and migration scenarios (Supplementary Note). (a) Accuracy of estimated African-Eurasian (τKHEX) and San (τKHEXS) divergence times without migration. Dotted lines indicate the values assumed for the simulations and each boxplot summarizes posterior mean estimates in six separate runs of G-PhoCS. Results are shown for correctly phased data (gold) and integration over unknown phasings (red). A random phasing procedure produced substantially poorer results (Supplementary Fig. 2). Most estimates fall within 10% of the true value, except for the smallest assumed divergence times, where weak information in the data leads to an upward bias. (b) Accuracy of the estimated San divergence time (τKHEXS) and the Yoruban/Bantu population size (θX) in simulations with four levels of constant-rate migration (denoted 0, 1, 2, and 3, in order of increasing strength) from population S to population X. Ratios of estimated to true values are shown when migration is not (blue) and is (red) allowed in the model. Each boxplot summarizes twelve runs. Notice that there is a pronounced bias when migration is present but is not modeled, but this bias is eliminated when migration is added to the model. Simulated and estimated migration rates (measured in expected number of migrants per generation) are shown at right. See Supplementary Figs. 2 & 3 for complete results.

