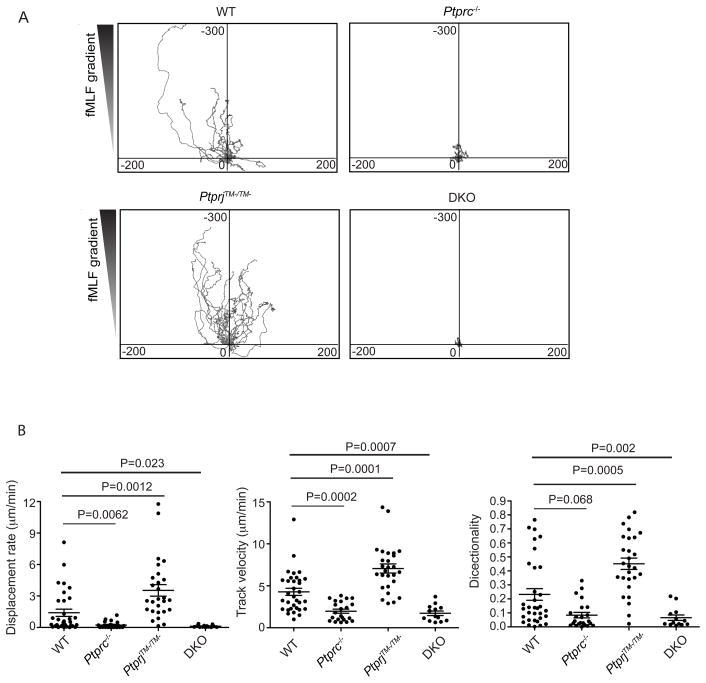
Figure 3. CD45 and CD148 regulate neutrophil chemotaxis in a distinct ways.
(A) Center-zeroed tracks of individual neutrophils in an EZ-Taxiscan chamber migrating towards reservoirs, located at the top of the diagrams, containing 3 μM fMLF. The scales of each graph are equal in μm. (B) Statistical analysis for the EZ-Taxiscan migration assay. Displacement rate (μm min−1), track velocity (μm min−1) and directionality (ratio of displacement to track, value 1 as maximum) were calculated by Volocity™. Each symbol represents an individual cell; small horizontal lines indicate means. p values were calculated by the student t test. See also Fig. S1, Movie M1,M2,M3,M4.

