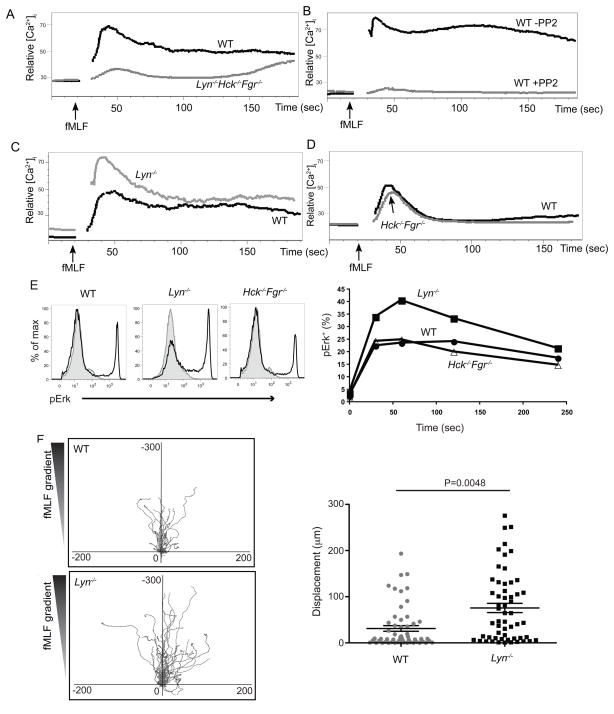
Figure 6. Disruption of SFKs results in impairment on fMLF induced signaling.
(A) Purified neutrophils from mice of the indicated genotypes were loaded with Fluo3-AM and Fura Red, and [Ca2+]i concentrations were monitored before and after addition of 0.2 μm fMLF. (B) Wild-type neutrophils were treated similarly as in (A), however prior to addition of fMLF, cells were incubated with or without 10 μm PP2 for 3 minutes. (C) (D) Neutrophils from wild-type, Lyn−/− (C), or wild-type, Hck−/−Fgr−/− (D) mice were treated similarly as in (A). (E) BM cells from mice of the indicated genotypes were stimulated with fMLF (0.5 μM) for the indicated times, fixed, permeabilized, and then stained with phospho-ERK along with other surface makers. Neutrophils were identified as CD11b+Gr1+. Phospho-ERK of stimulated (1 min) and control samples were overlaid as histograms (control as grey shade and stimulated as black line). Percentages of pERK+ cells over a time course are shown on the right side. Data are representative of three independent experiments. (F) fMLF mediated chemotaxis was measured on an EZ-Taxiscan chamber as shown in Fig. 3. Left panel shows center-zeroed tracks of individual neutrophils on migrating towards reservoirs, located at the top of the diagrams, containing 0.5 μM fMLF. The scale of each graph is equal in μm. Right panel is a statistical analysis for the EZ-Taxiscan migration assay. p values were calculated by student t test. See also Fig. S3, Movie M5, M6.

