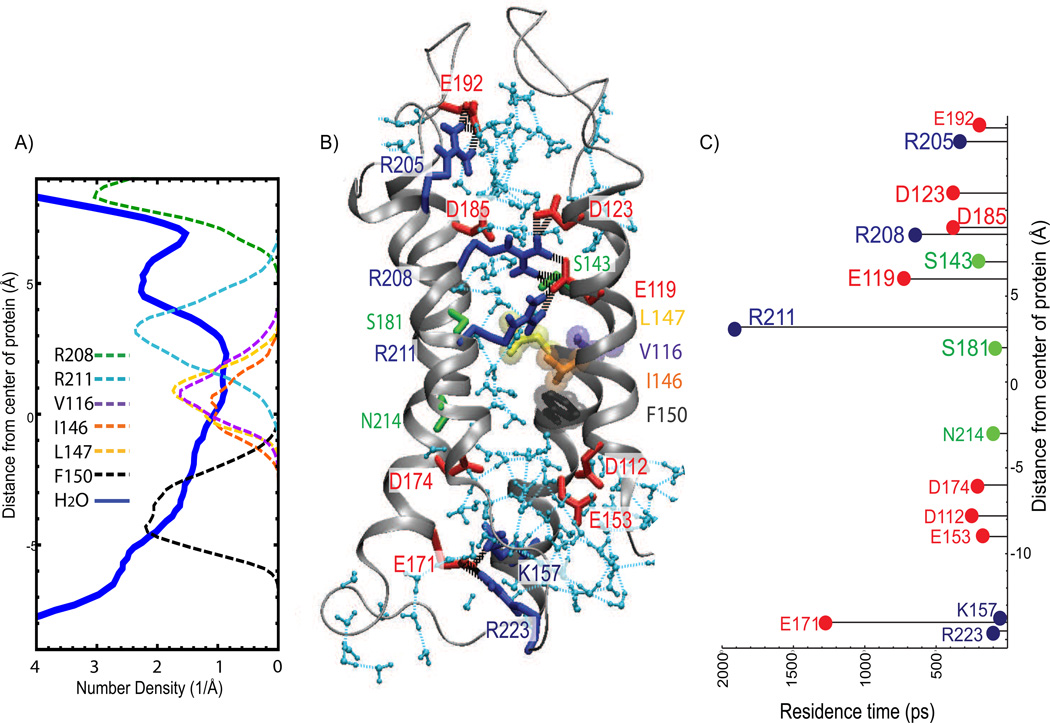
Figure 4.
R1-Hv1 permeation pathway structure and dynamics. (A) Number density profile of water oxygen (thick line) and heavy atoms of selected side chains (dashed lines). (B) Snapshot of R1-Hv1 model. Waters in the interior of the channel are colored light blue. Amino acid residues are shown in licorice representation. Basic residues are colored blue, acidic residues are in red, and polar residues are colored green. V116, I146, L147, and F150 are shown in purple, orange, yellow and dark grey, respectively. Water-water (light blue dashed lines) and protein-protein (black dashed lines) hydrogen bonds are shown; hydrogen bonds between waters and charged residues are omitted for clarity. (C) Residence times of water for selected residues along the water wire. The constriction region in the R1-Hv1 permeation pathway is formed by a cluster of hydrophobic residues (V116, I146 and L147) located, roughly, at the center of the protein, and by R211 in the extracellular cavity. F150 is the closest side chain to the constriction on the intracellular side. N214 is located approximately at the same position as F150 along the transmembrane direction but is away from the constriction. H-bonded networks of waters and polar side chains including S181, S143, and salt-bridge chains between R211, E119, R208 and D123 occupy the extracellular cavity. The elevated water residence times in the H-bonded network, especially around R208, E119, and R211, suggest that those residues have a role in stabilizing the water wire.

