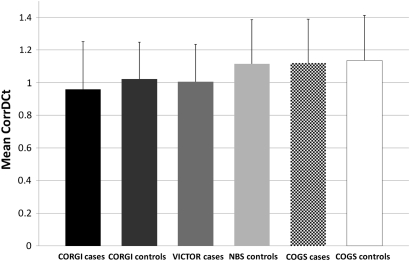
Figure 2.
Telomere lengths in cases and controls from each sample set. The bar chart shows mean CorrDCt for each sample set (error bars show standard deviations). Note the shorter telomeres in cases than controls, with the exception of the COGS cases, which have similar lengths to the some other control sample sets, although shorter lengths than their corresponding controls.

