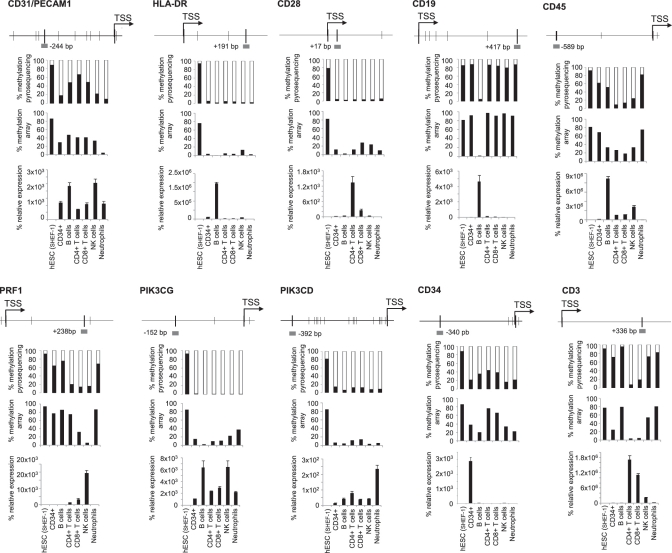
Figure 3.
Promoter methylation and expression of ten key genes of the hematopoietic system. For each gene, we depict (from top to bottom): the diagram showing the genomic region surrounding the transcriptional start site (TSS, arrow). Thin black vertical bars indicate CpG position and a grey horizontal bar indicates the location (distance in base pair from TSS) of the probe used in methylation arrays and validated by pyrosequencing in the indicated samples; percentage of promoter methylation as detected in the pyrosequencing reaction; percentage of promoter methylation as detected in the Illumina Infinium array and mRNA expression relative to GAPDH as measured by qRT–PCR in the indicated samples (n = 3, mean ± SD).

