Figure 5.
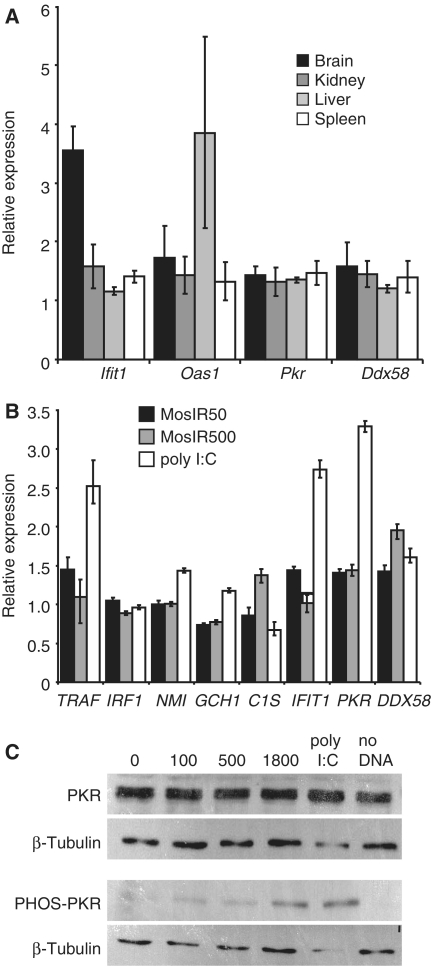
Analysis of the IFN response genes in mice and cell lines. (A) Analysis of expression of IFN stimulated genes (ISGs) Ifit1, Oas1, Pkr and Ddx58 in different tissues of MosIR mice. The expression was estimated by qPCR and is shown relative to wild-type siblings. For each gene, samples from three MosIR animals were analyzed in duplicates. Hprt was used as an internal standard. Error bars = SEM. (B) Analysis of expression of ISGs in 293 cells transfected with 50 and 500 ng (per well in a 24-well plate, the total amount of the transfected DNA was kept constant by adding pCAGEGFP DNA) of the MosIR plasmid 48 h after transfection. The expression was estimated by qPCR and is shown relative to 293 cells transfected with 100 ng/well of the pCAGEGFP plasmid. For comparison, ISGs were stimulated by adding poly I:C to the media. HPRT1 was used as an internal standard. The experiment was performed in triplicates. Error bars = SEM. (C) Western blot analysis of induction of PKR phosphorylation by the MosIR plasmid. Cells in 6-well plates were transfected with 100, 500 or 1800 ng of the MosIR plasmid and harvested for western blot analysis 24 h after transfection. The total amount of the transfected DNA was adjusted to 2 µg in all samples by adding corresponding amount of pCAGEGFP DNA. The majority of transfected cells showed green fluorescence (data not shown), toxicity of the MosIR to the cells was not apparent. Poly I:C was added to the media to a final concentration of 1 µg/ml and it was apparently toxic to the cells.

