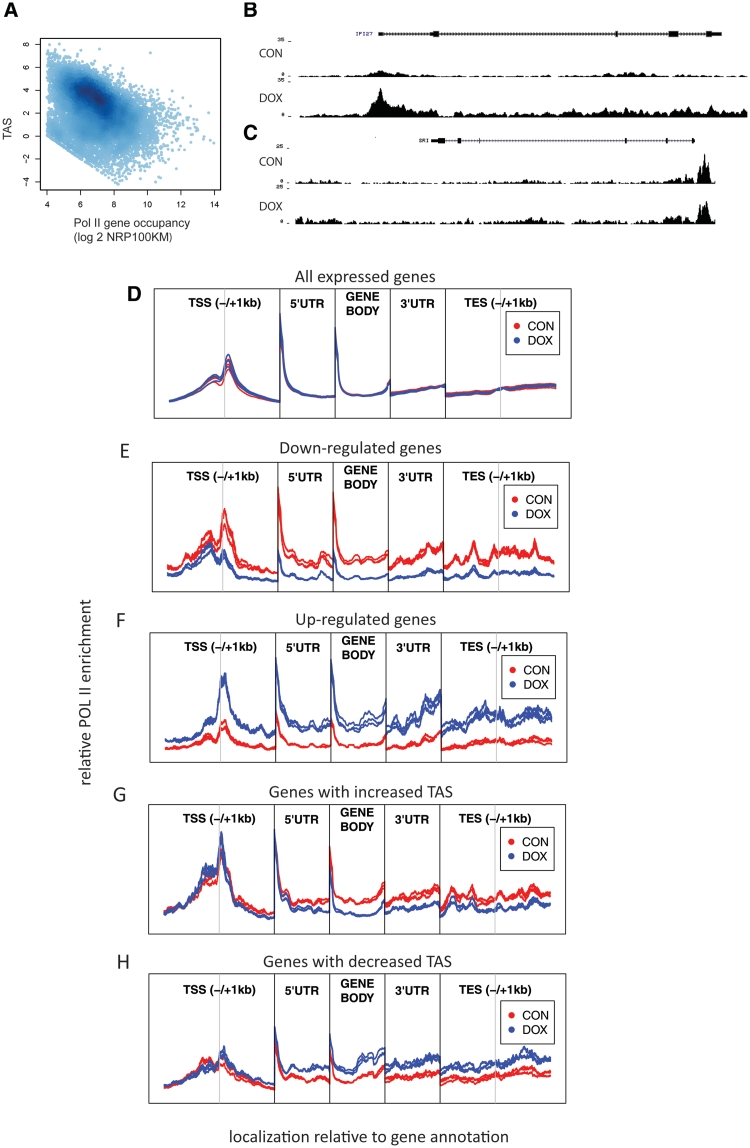
Figure 3.
Poised polymerase and metagene analysis of Pol II occupancy. (A) Correlation of total Pol II occupancy with TAS score. The TAS score represents the relative enrichment of POL II at the promoter compared to the gene body and reflects the fraction of poised polymerase. Genes with lower expression have more Pol II deposited on their transcription start site and less processing polymerase in the gene body compared to genes with higher expression (r = −366). (B, C) Pol II coverage for up-regulated genes with (B) increased density over TSS and gene body and (C) increased density in gene body without change in TSS. (D) Relative enrichment of POL II sequencing tags in Wnt plus (CON) and Wnt minus (DOX) samples with respect to gene annotation in (D) all annotated genes (E) down-regulated and (F) up-regulated genes. POL II enrichment changes simultaneously in TSS and gene body, suggesting that a substantial proportion of transcription regulation is mediated by changes in POL II recruitment. In subclass of genes, with increase (G) or decrease (H) in relative enrichment of POL II at the promoter compared to gene body; difference of POL II accumulation in downstream part of genes is not accompanied by change in enrichment on TSS. Every individual region is normalized separately against input and average enrichment of CON samples.

