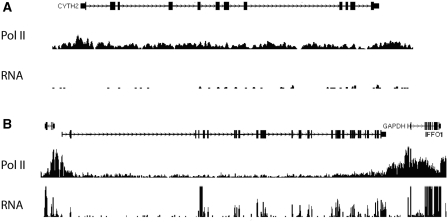
Figure 6.
Examples of Pol II and RNA-seq coverage over of genes with low (A) and high (B) RNA stability. The vertical axis represents relative sequencing tag coverage per position (A) A gene (CYTH2) with high density of sequencing tags over the gene body with very low levels of RNA. Pol II ChIP-seq classifies the depicted gene as expressed; however, both RNA-seq and microarrays classify the gene as non-expressed (Class I gene). (B) Genes (IFFO1 and GAPDH) with high density of Pol II ChIP-seq tags mapping to the gene body and with high numbers of sequencing RNA-seq tags mapping to annotated exons.

