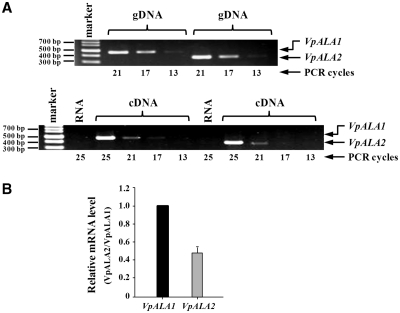
Figure 5.
Analysis of endogenous VpALA1 and VpALA2 mRNAs by RT–PCR. (A) A semiquantitative RT–PCR. PCR amplification of VpALA1 and VpALA2 DNA fragments using genomic (g)DNA as the template (upper panel); RT–PCR amplification of VpALA1 and VpALA2 mRNAs using complementary (c)DNA as the template (lower panel). RNA control denotes PCR amplification using RNA, instead of cDNA, as the template. (B) qRT–PCR.

