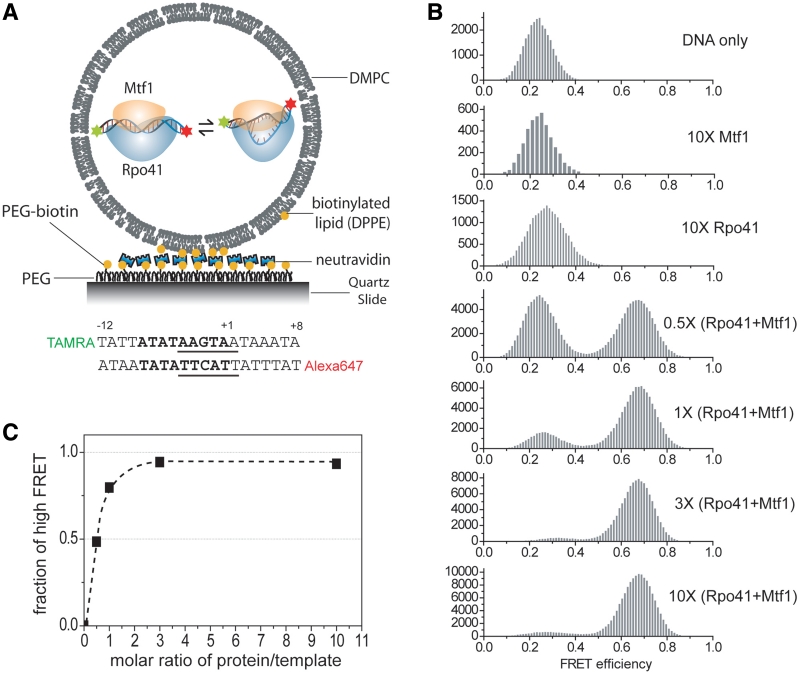
Figure 1.
smFRET titration of the promoter with Rpo41-Mtf1 inside lipid vesicles. (A) Schematic of surface-immobilized vesicles containing the initiation complex. Below is the design of promoter template. Promoter sequence (−8 to +1) is shown in bold. Transcription start site is defined as +1. Melting region (−4 to +2) is underlined. (B) Change of smFRET histogram upon adding proteins as indicated. DNA concentration was kept at 400 nM during vesicle preparation which corresponds to roughly one molecule in the volume of 200 nm diameter sphere. Protein concentration is represented as multiples of DNA concentration. (C) Change of the fraction of high FRET population as a function of the molar ratio of (Rpo41 + Mtf1)/DNA.

