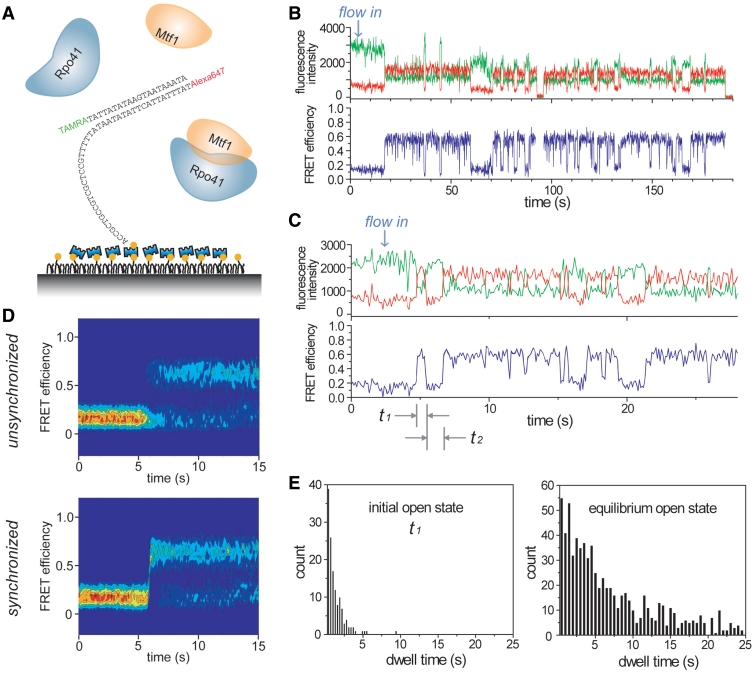
Figure 4.
Instability of the initially open promoter. (A) Schematic of surface-tethered template shown with protein mixture being flown in. (B) Typical time trace showing successful promoter opening. (C) Typical time trace demonstrating transient opening trial in the beginning. (D) Time evolution of FRET distribution obtained from 177 molecules when 100 nM Rpo41/Mtf1 was flowed in. Lower plot was synchronized at the moment of FRET exceeding 0.45. (E) Lifetime distributions of the first open state, t1 in (C), and the equilibrium open state.

