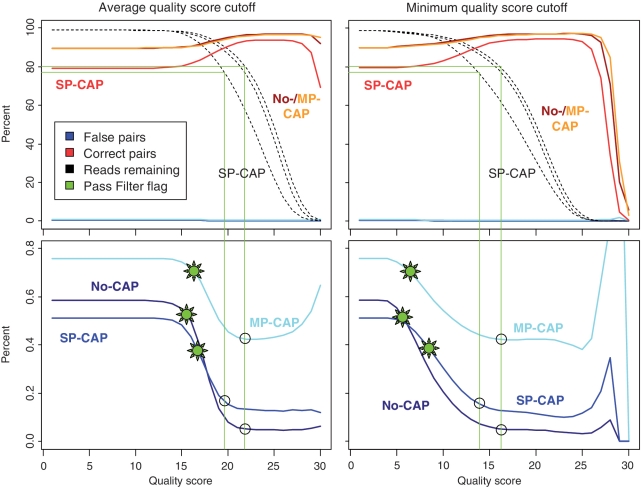
Figure 2.
Changes in the fraction of false (blue) and correct (red) index pairs when applying two different types of base quality filters on the index reads (minimum accepted quality score and average quality score). The fraction remaining after PF is indicated by a green ‘sun’ symbol. Black circles denote the fraction of reads remaining when considering quality score cutoffs that remove just a little bit less raw data than the Pass Filter flag (green lines, ~20% of the data). Both filter criteria remove considerably more false pairs. While no-CAP, SP-CAP and MP-CAP show similar trajectories, the fraction of false pairs is always considerably higher for the MP-CAP experiment, in which samples have been enriched and amplified in a multiplex setup. Quality score cutoffs for the SP-CAP experiment are lower than for the other two experiments due to the 40% higher cluster density of this experiment.

