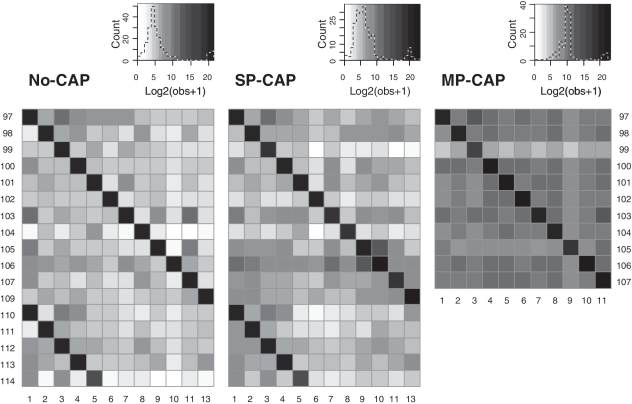
Figure 3.
Heat map with the counts observed for all index combinations in the experiments no-CAP, SP-CAP and MP-CAP after applying a minimum quality score filter of 15 to the index reads. Only indexes that were actually used in the experiments are plotted; forward indexes on the horizontal and reverse indexes on the vertical axis. Color frequencies are provided for each of the experiments in the top right graphs.

