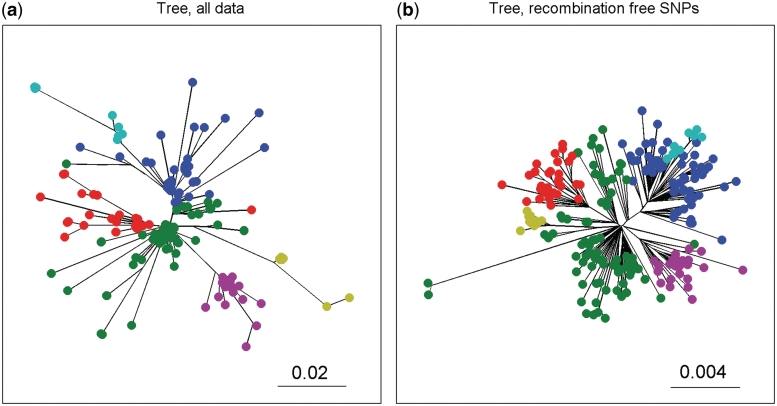
Figure 5.
Maximum likelihood phylogenetic trees for S. pneumoniae data. (a) and (b) show the maximum likelihood phylogenetic trees for S. pneumoniae data, constructed using either all data or polymorphisms outside any inferred recombination events, respectively (28). Both trees are drawn as unrooted. The clustering obtained from our analysis using the PSA tree in Figure 4 is indicated in the trees by coloring the leaf nodes using the same cluster specific colors as in Figure 4.

