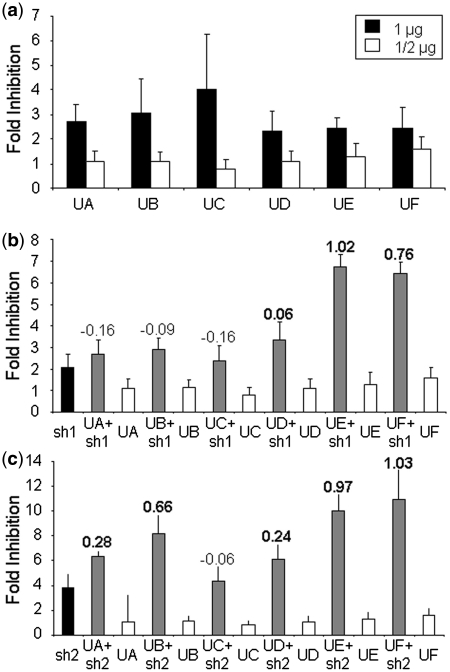
Figure 3.
Analysis of U1ins targeting HBV in culture. (a) Expression inhibition of HBV sequences with U1i. Luciferase activity was measured in HuH7 cells co-transfected with pCH-FLuc and a control plasmid or 1 µg or 1/2 µg of each plasmid expressing U1inαHBV. (b and c) Effect of the co-expression of U1inαHBV and shRNAs αHBV on the expression from HBV sequences. Luciferase activity was measured as before but in cells co-transfected with pCH-FLuc and 1/2 µg of a plasmid expressing a control U1in, each U1inαHBV, sh1 (b), sh2 (c) or a combination of 1/2 µg of a plasmid expressing an U1inαHBV and 1/2 µg of a plasmid expressing sh1 (b) or sh2 (c). The FI is indicated for each case. Note that the scale is different for each figure. The SI is indicated at the top of the corresponding bars. Synergistic inhibitions are highlighted with an SI in bold. Data are mean ± SD from a minimum of five independent experiments.

