Figure 6.
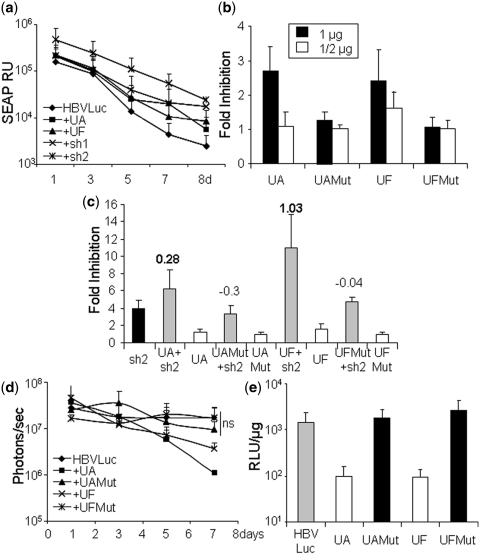
Analysis of the specificity of U1ins targeting HBV. (a) C57BL/6 mice were injected with pSEAP and pCH-Fluc plasmid (HBVLuc) combined or not with plasmids expressing UA, UF, sh1 or sh2. SEAP was quantified in blood extracted at the indicated times post-injection. SEAP RU indicates relative units of SEAP. (b and c) Luciferase activity was evaluated in HuH7 cells treated as described in Figure 3 with the exception that the cells were transfected with plasmids expressing inhibitors UA, UAMut, UF and UFMut alone (b) or in combination with sh1 or sh2 (c). Cells expressing sh1 or sh2 alone were also evaluated (c). The FI is indicated for each case. Note that the scale is different for each figure. The SI is indicated at the top of the corresponding bars. Synergistic inhibitions are highlighted with an SI in bold. (d and e) C57BL/6 mice were injected with pCH-Fluc plasmid (HBVLuc) combined or not with plasmids expressing UA, UAMut, UF and UFMut. Luciferase activity was quantified in living mice with a CCD camera at the indicated times post-injection (d) or in liver extracts obtained 8 days post-injection (e). RLU indicates relative light units. Data are mean ± SD from at least two independent experiments.

