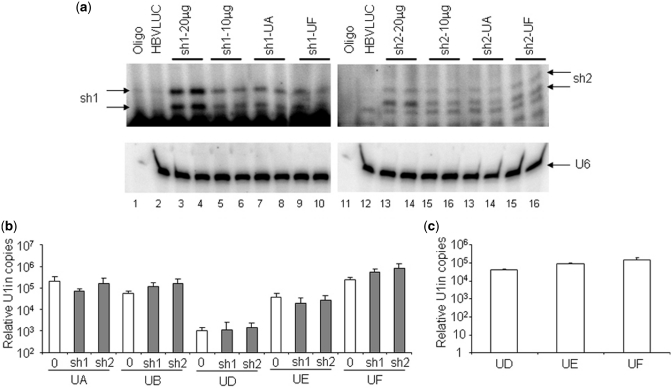
Figure 8.
Quantification of shRNAs and U1in targeting HBV. (a) Quantification of shRNAs. sh1 and sh2-derived siRNAs were visualized by extension with a sh1 (lanes 1–10) or sh2-specific (lanes 11–20) labeled primer of RNAs isolated from the liver of C57BL/6 mice injected with pCH-Fluc plasmid (HBVLuc, lanes 2 and 12) alone or combined with 20 or 10 µg of plasmids expressing sh1 or sh2 or with 10 µg of plasmids expressing sh1 or sh2 and 10 µg of plasmids expressing UA or UF. U6 snRNA was also evaluated by primer extension as a loading control (bottom). Two shRNA-expressing animals were evaluated for each condition. Labeled primer incubated with buffer was run in parallel (Oligo). (b) Quantification of U1in in vitro and in vivo. Exogenous U1in expression was quantified by RT-PCR from liver extracts obtained as described in Figure 5 (b) or extracts from HuH7 cells transfected with plasmids expressing UD, UE or UF as described in Figure 3 (c). Actin mRNA was also quantified to allow comparison between different samples. Data are mean ± SD from five (a) or six (b) samples from two independent experiments.

