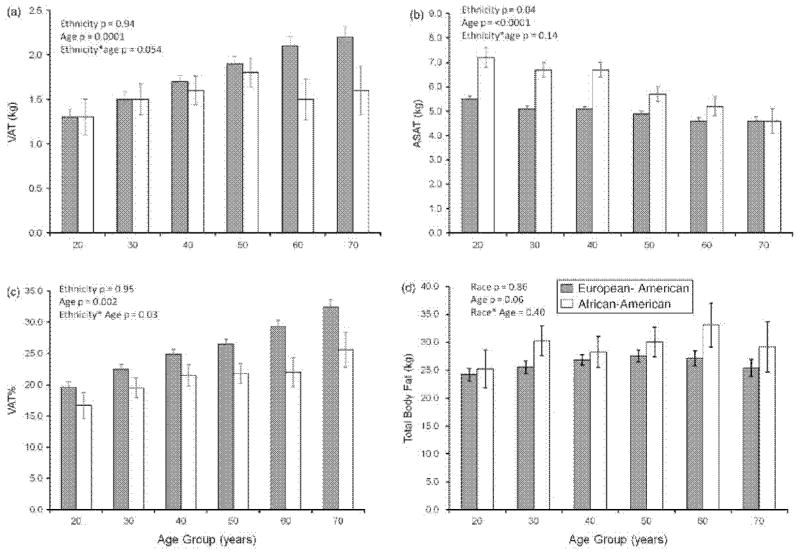
Figure 1.
Multivariate-adjusted estimates of visceral and abdominal subcutaneous adipose tissue mass, percentage abdominal visceral adiposity and total body fat by age group and ethnicity (mean, standard error). VAT, visceral adipose tissue mass; ASAT, abdominal subcutaneous adipose tissue mass; %VAT, percentage visceral adipose tissue, VAT/VAT + ASAT, %; TBF, total body fat. In European American women (gray bars), n = 94, 105, 143, 132, 85, 58. In African-American women (white bars), n = 17, 28, 19, 26, 12, 9. p-values are from an ethnic-group-combined linear regression model including ethnicity, age group, ethnicity*age group, menopausal status, total adipose tissue mass (TBF), current smoking (yes/no) and sport activity level.

