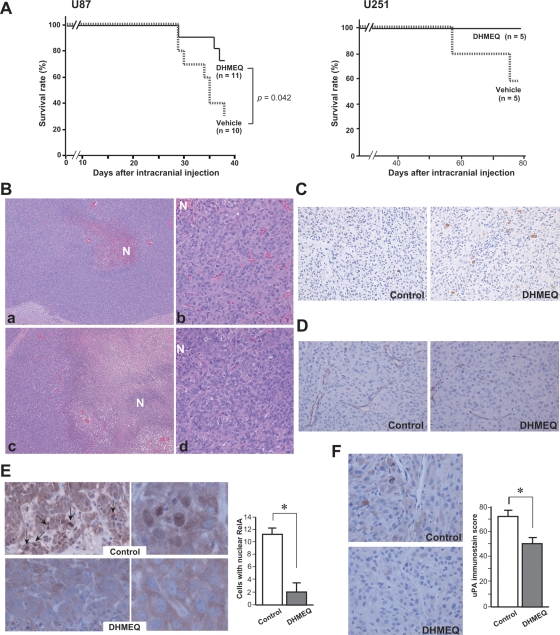
Fig. 6.
Effect of DHMEQ treatment on intracranial implantation of glioblastoma cells. (A) Kaplan-Meier survival curves of mice treated with or without DHMEQ; 1 × 10⁵ (U87) or 1 × 10⁶ (U251) cells were transplanted into the forebrain of each mouse. P value, log-rank test. (B) Histology (hematoxylin and eosin stain) of the intracranial tumors derived from U87 without (a, b) or with (c, d) DHMEQ treatment. DHMEQ-treated tumor (c) shows larger necrotic area (N) than control tumor (a). Original magnification, ×40 (a, c) or ×200 (b, d). (C) Immunoreactivity of cleaved caspase 3 (U87, ×200). (D) Immunoreactivity of CD31 (U87, ×200). Microvessels in DHMEQ-treated tumors show a collapsed pattern. (E) Immunoreactivity of RelA (U87; ×400, left panel; ×1300, right panel). Arrows indicate nuclear immunoreactivity. Mean ± SD (n = 4) of positive cells/×400 field is indicated as a bar graph. *P < .05, Mann-Whitney U test. (F) Immunoreactivity of uPA in tumor cells (U87). Immunoscore was calculated and indicated as a bar graph (mean ± SD, n = 4). *P < .05, Mann-Whitney U test.

