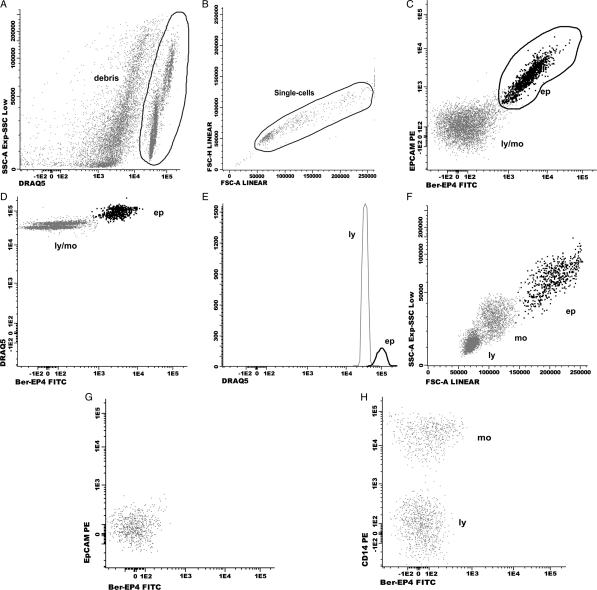
Fig. 2.
Dot-plots showing an EpCAM positive CSF sample (A–F) and a negative sample for LC (G, H). Consecutive steps for data analysis: first step (A): identification of the CSF cell compartment based on the selection of DRAQ5 positive events. Second step (B): single-cell gate based on the selection of FSC-H vs FSC-A. Third step (C): identification of epithelial cells (ep) based on expression of EpCAM. Forth step (D, E): confirmation of a higher DNA content on epithelial cells with respect to lymphocytes DNA content. Fifth step (F): identification of inflammatory cells: lymphocytes (ly) and monocytes (mo). Epithelial cells (ep) have a heterogeneous size (FSC, forward scatter), and granularity (SSC, side scatter) as compared to lymphocytes and monocytes. No positive cells for the mAb Ber-EP4 and EpCAM are found in G and H. Positive staining for CD14 identifies monocytes. FITC: fluorescein isothiocyanate; PE: phycoerythrin.

