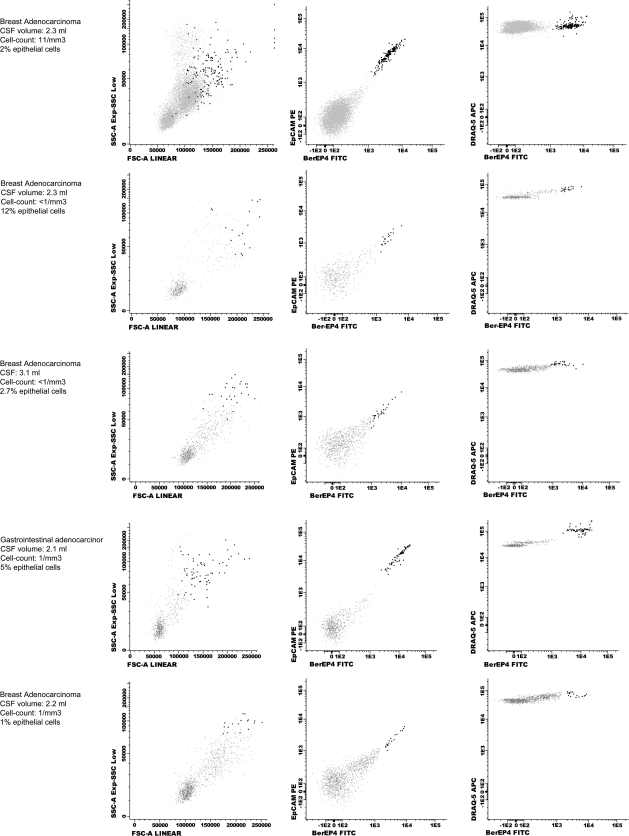
Fig. 3.
FCI data from patients in the TP FCI group. Epithelial cells are painted in dark black, and inflammatory cells in grey. In all cases, cytology was informed as no data of malignancy. Volume of CSF sample received, CSF cell-count and percentage of malignant cells detected by FCI in every patient are specified. FSC: forward scatter; SSC: side scatter; FITC: fluorescein isothiocyanate; PE: phycoerythrin.

