
Figure 5. Midgut insulin acts directly on stem cells to induce intestinal growth.
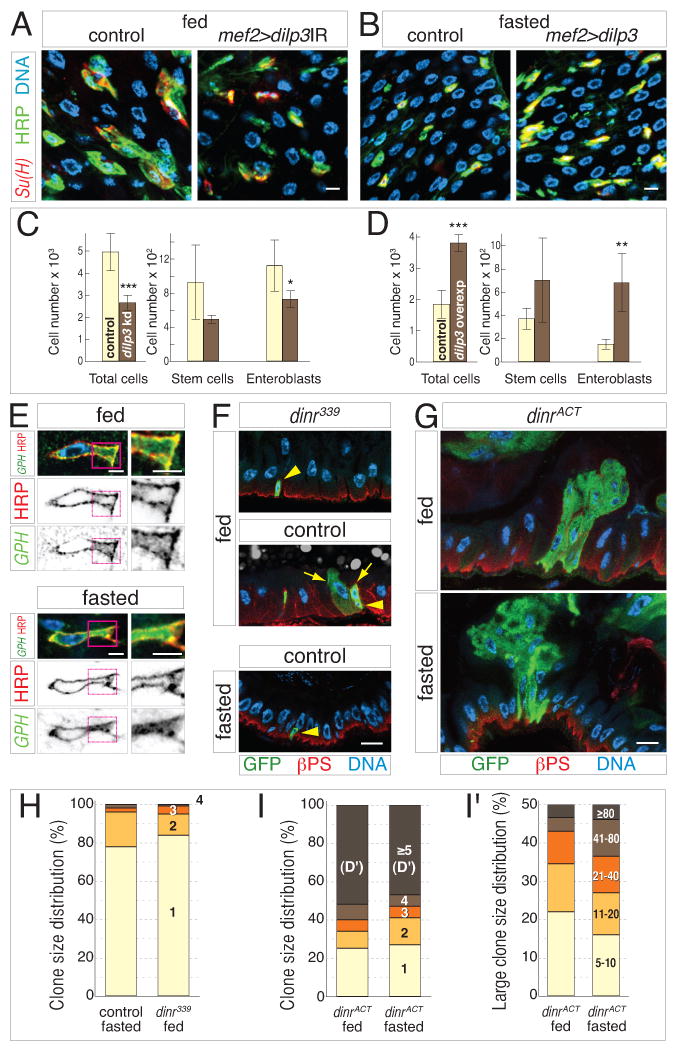
(A-B) Midgut dILP3 controls progenitor cell abundance downstream of feeding. Knockdown (Su(H)lacZ; mef2ts>dilp3IR), overexpression (Su(H)lacZ; mef2ts>dilp3), and control (Su(H)lacZ; mef2ts) midguts were stained for β-galactosidase (red), HRP (green), and DNA (blue). (A) Visceral muscle depletion of dilp3 reduces the abundance of enteroblasts (HRP+, Su(H)+) and stem cells (HRP+, Su(H)) in 4-day fed guts. (B) Exogenous expression of dILP3 in muscle increases the abundance of enteroblasts and stem cells in 4-day fasted guts. Scale bars, 5 μm.
(C-D) Cell censuses of 4-day distal hairpins. (C) In fed guts, visceral muscle knockdown of dilp3 causes ∼2-fold reduction of total cell number and decreased progenitor cell numbers. (D) In fasted guts, muscle overexpression of dilp3 causes ∼2-fold increase in total cell number and increased progenitor cell numbers. Data are means ± S.D. Total cells, p<0.0005; knockdown enteroblasts, p<0.05; overexpression enteroblasts, p<0.01. See also Supplemental Table S5.
(E) The insulin pathway reporter tGPH (green) is enriched at the stem cell plasma membrane (HRP, red) under fed conditions (top) but is uniformly cytosolic under fasted conditions (bottom). DNA in blue. Right panels show enlarged views of stem cell cytoplasm. Scale bars, 2.5 μm.
(F-I) dInR controls stem cell divisions downstream of feeding. (F) dInR is necessary for feeding-induced stem cell divisions. At 4 days, dinr339 clones (green; βPS integrin in red and nuclei in blue) contain only 1 cell in fed (top) and fasted (bottom) guts, while control clones (middle) contain multiple cells. Arrows and arrowheads indicate stem cells and committed daughters, respectively. (G) dInR activation is sufficient for stem cell proliferation in the absence of food. At 4 days, dinrACT clones (green) are comparably large in fed (top) and fasted (bottom) guts. Scale bar, 10 μm. (H) The size distribution of dinr339 clones in fed guts resembles control clones in fasted guts. (I) The size distribution of dinrACT clones in fasted guts resembles dinrACT clones in fed guts, even for large clones (≥5 cells; detailed in I'). See also Supplemental Table S6.