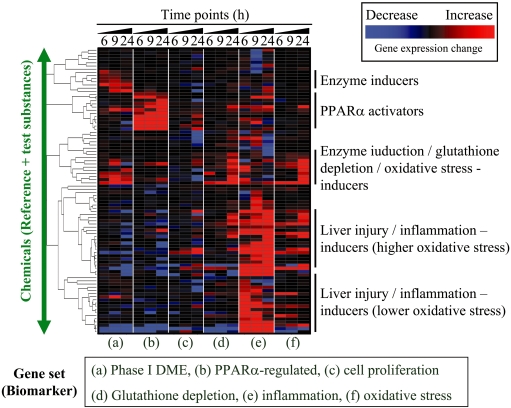
Fig. 2.
Characterization of hepatic toxicity profile. An example of characterizing the hepatic toxicity profile is presented. In this figure, six TGx biomarker gene sets associated with a) phase I drug metabolizing enzyme (DME), b) PPARα-regulated genes, c) cell proliferation, d) glutathione depletion, e) inflammation and f) oxidative stress are used to assess toxicity profiles based on the microarray data for rat livers treated with one of 90 chemicals. The microarray data was retrieved from TG-GATEs, a TGx database developed by the Toxicogenomics Project in Japan (TGP), after obtaining permission. The expression changes for each biomarker set were summarized and estimated using the TGP1 score174, and the TGP1 score was subjected to hierarchical clustering. The red and blue colors indicate that the genes included in the TGx biomarker were generally up- or down-regulated, respectively, and the black color indicates that the expression level of the TGx biomarker gene sets did not show characteristic changes as a whole. Ideally, chemicals that do not affect the expression levels of genes included in the TGx biomarker would be desirable drug candidates. This strategy is applied to rank the chemicals based on the toxicity profiling.

