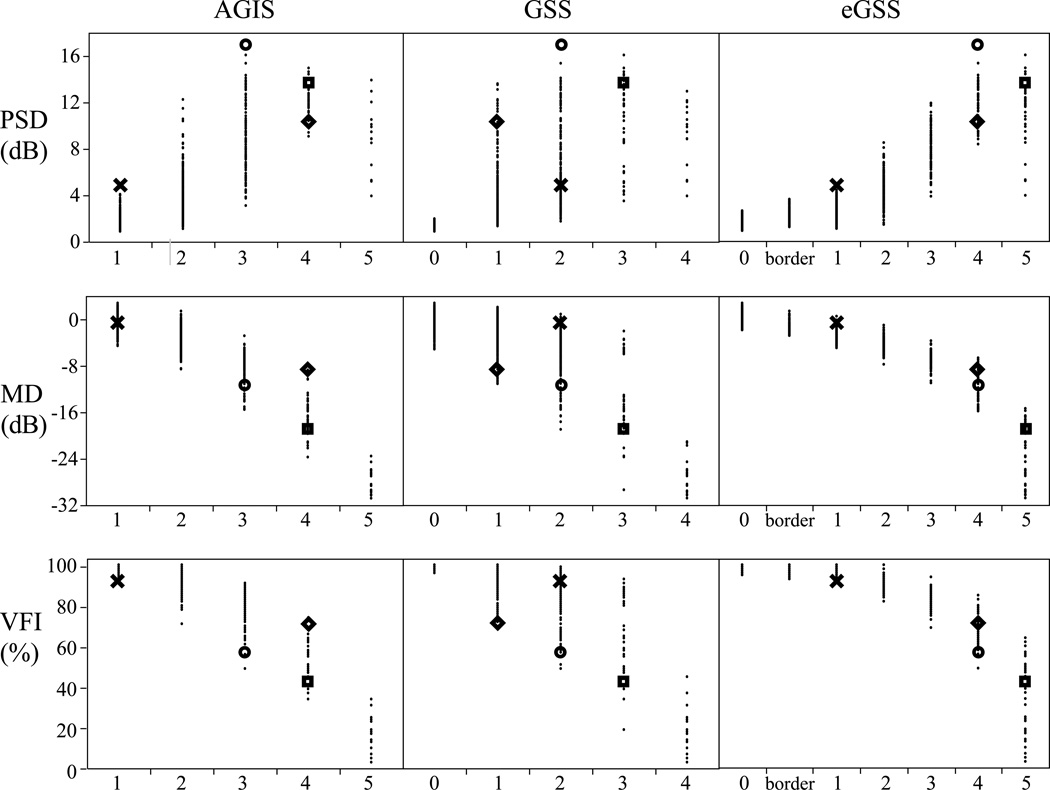
Figure 2.
Pattern standard deviation (PSD), mean defect (MD) and visual field index (VFI) distributions by severity stage according to three classification systems: Advanced Glaucoma Intervention Study scoring system (AGIS), Glaucoma Severity Staging system (GSS) and the Enhanced Glaucoma Severity Staging system (eGSS). (N=1,921 visual fields; four examples are highlighted, which correspond to examples shown in Figure 1.)

