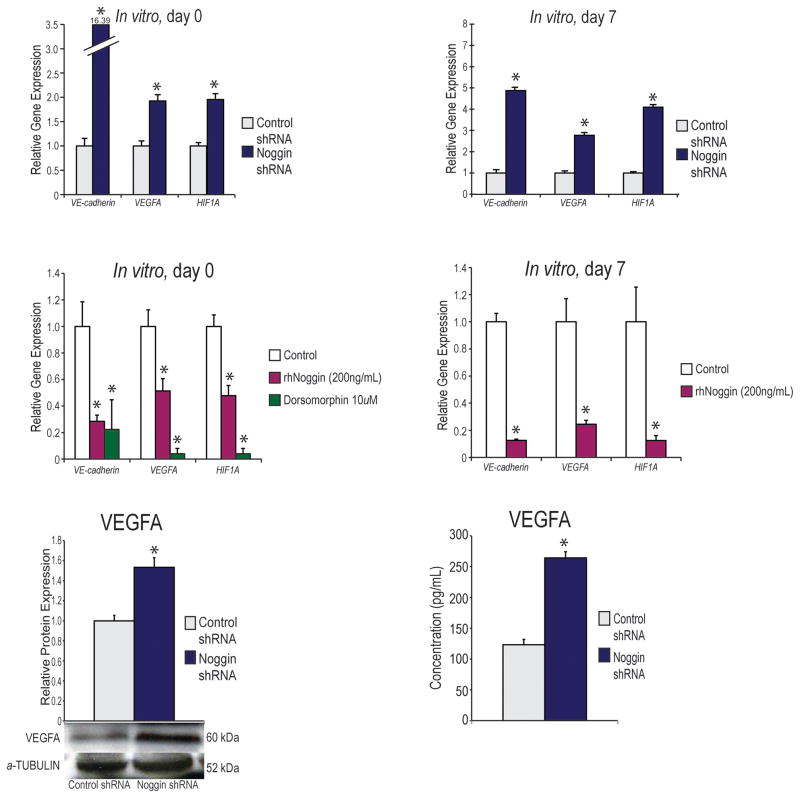
Figure 1. Effect of noggin suppression on angiogenesis in vitro.
(A) Angiogenic gene expression profile of hASCs cultured in Standard Growth Medium (SGM). Markers examined include angiogenic specific genes, VE-CADHEREIN, VEGFA and HIF1A. An up regulation of all genes was noted in noggin-suppressed cells. A student’s two sample t-test was used to compare groups (mean expression +/− S.D. *p<0.05) (B) Gene expression profile of hASCs after seven days of osteogenic differentiation. Markers examined include angiogenic specific genes, VE-CADHEREIN, VEGFA, and HIF1A. An up regulation of all genes was noted in noggin-suppressed cells (mean expression +/− S.D. *p<0.05). All transcript levels were expressed relative to shRNA control. A student’s two sample t-test was used to compare groups. (C) Angiogenic gene expression profile of hASCs cultured in SGM with or without addition of rhNoggin (200ng/ml) or dorsomorphin (10uM). Markers examined include angiogenic specific genes, VE-CADHEREIN, VEGFA, and HIF1A. A down regulation of all genes was noted in rhNoggin treated and dorsomorphin treated hASCs (mean expression +/− S.D. *p<0.05) A two sample t-test was used to compare the control group to each treatment groups separately and then a Bonferonni correction was performed to handle multiple hypothesis testing. (D) Gene expression profile of hASCs after seven days of osteogenic differentiation with or without addition of rhNoggin (400ng/ml). Markers examined include angiogenic specific genes, VE-CADHEREIN, VEGFA, and HIF1A. A down regulation of all genes was noted in rhNoggin treated hASCs. A student’s two sample t-test was used to compare groups (mean expression +/− S.D. *p<0.05) (E) VEGFA protein levels of control shRNA and Noggin shRNA transfected cells by Western Blot analysis. A student’s two tailed t-test was used to compare groups (mean expression +/− S.D. *p<0.05). (F) VEGFA protein secretion by control shRNA and Noggin shRNA transfected cells measured by VEGF ELISA. A student’s two tailed t-test was used to compare groups (mean expression +/− S.D. *p<0.05).

