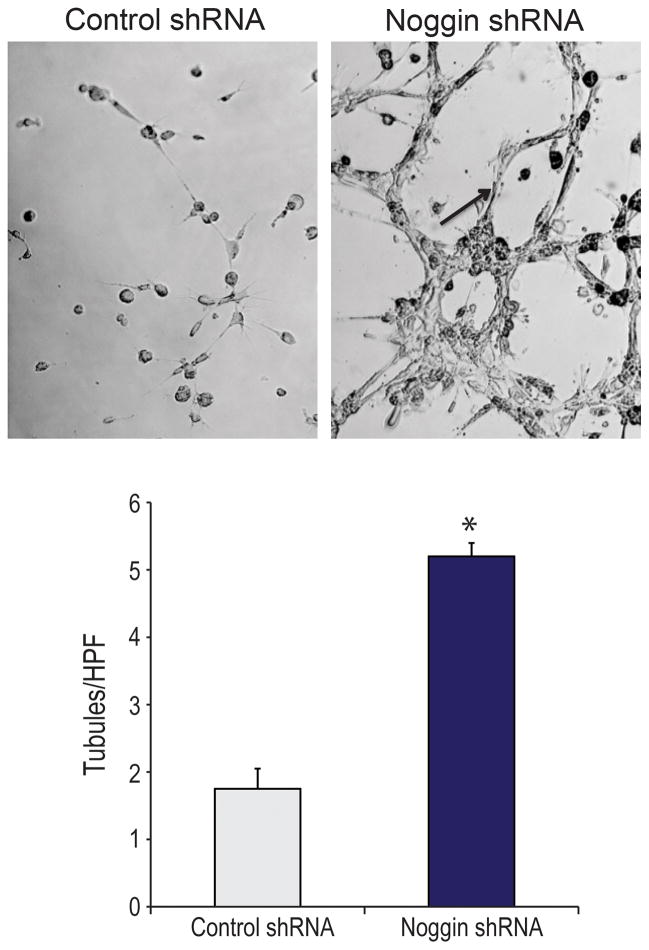
Figure 2.
(A) In vitro tubule assay of control shRNA and Noggin shRNA cells in matrigel after 12 hours of hypoxia. (B) Quantification of tubules of control shRNA and Noggin shRNA cells as counted by 5 blinded, independent observers. A student’s two tailed t-test was used to compare groups (mean expression +/− S.D. *p<0.05).

