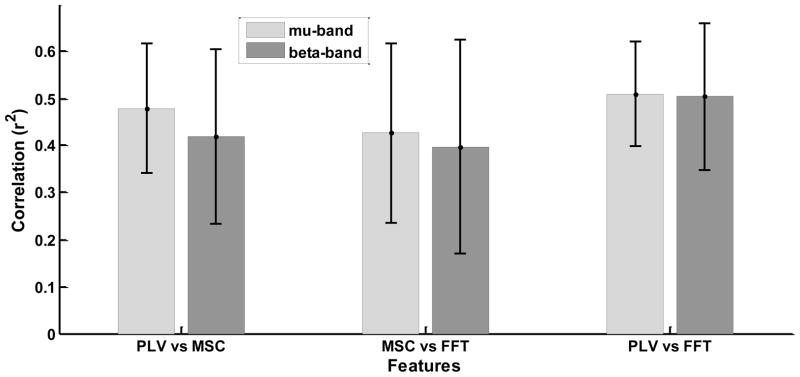
Fig. 4.
The r2 correlation between the most prominent features derived from each pair of feature extraction methods for the mu and beta bands, respectively. For each user, the mu- and beta- band feature that had the maximum r2 correlation with the target position were selected as the most prominent feature for each band. The channel pair and frequency defining these prominent features tended to be common across feature extraction methods, thus the same features were compared across methods. The results were averaged across users and the error bars indicate standard deviation.

