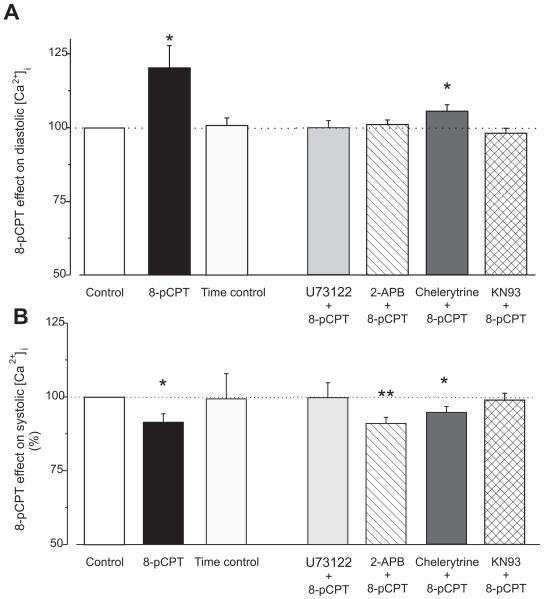
Figure 2. Epac differently modulates diastolic and systolic [Ca2+]i in the cytosol.
A. Epac-induced increase in diastolic [Ca2+]i during field stimulation at 1 Hz. Fluorescence value in each cell during 8-pCPT perfusion was normalized with the value in the same cell before 8-pCPT perfusion. White bar indicate the control in every conditions (n=59), black bar indicates 8-pCPT alone (n=13). Next to the right are time controls (same perfusion time than 8-pCPT but with control solution, n=8). Further to the right, 8-pCPT effect on diastolic [Ca2+]i in the presence of various inhibitors: Light grey bar indicates PLC inhibitor (2 μmol/L U73122, n=9), hatched bar are IP3R blocker by 2 μmol/L 2-APB (n=16), dark are PKC inhibitor 2 μmol/L chelerytrine (n=14), crosshatched are CaMKII inhibitor 1 μmol/L KN93 (n=22). B. The same than in A but for the peak [Ca2+]i fluorescence during the twitch. Bar colors and n numbers as in A. *p<0.05, **p<0.001.

