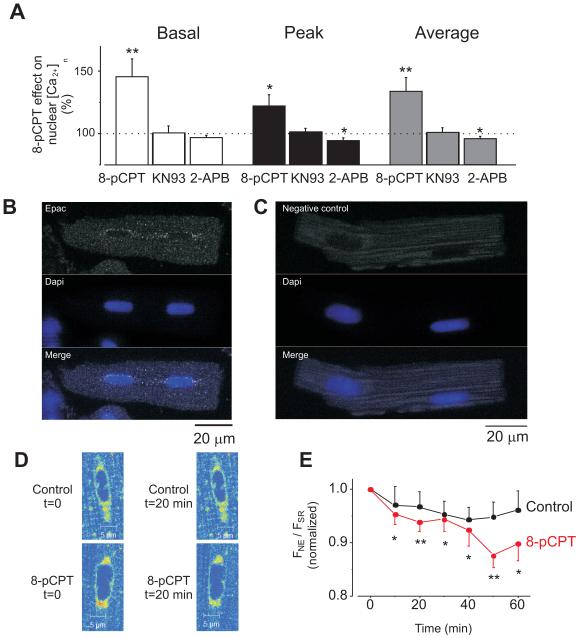
Figure 4. Endogenous Epac preferentially localizes at perinuclear area and its activation induces [Ca2+]n increment via CaMKII and IP3Rs pathways.
A. Percentage variations in the [Ca2+]n induced by 10 μmol/L 8-pCPT (n=13) and in the presence of 1 μmol/L KN-93 (CaMKII inhibitor; n=8) or 2 μmol/L 2-APB (IP3R inhibitor; n=13) during constant field stimulation at 1 Hz. Increase in basal Ca2+ fluorescence (during diastolic period) is represented in the white bar, the maximum Ca2+ fluorescence (peak) is represented by the black bar and the average Ca2+ fluorescence (average) is represented by the grey bar. B. Image of a rat ventricular cardiomyocyte immunolabeled with Epac antibody and DAPI to localize the nuclei. Epac fluorescence is shown in the top, nuclei in the middle and merged image in the bottom. C. Negative control: cells were treated as in A but primary antibody was omitted. D. Details of Mag-Fluo-4-AM loaded myocytes to differentially visualize sarcoplasmic reticulum (SR) from nuclear envelope (NE) Ca2+ stores at control conditions (t=0) and following 20 minutes (t=20) of perfusion with control solution (top) or 10 μmol/L 8-pCPT (bottom). E. Averaged traces of nuclear and cytosolic fluorescence (FNE/FSR) in perfused with 10 μmol/L 8-pCPT (red, n=8) and control (black, n=5) myocytes. The afluorescence observed was normalized to the initial FNE/FSR ratio for each cell. *p<0.05, **p<0.01.

