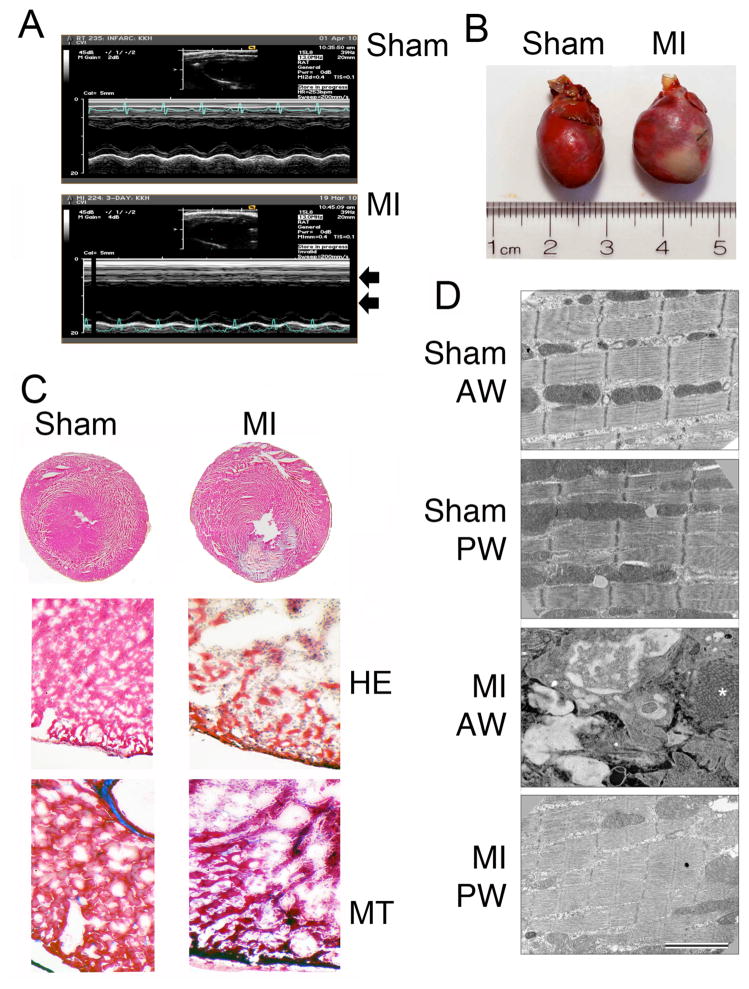
Fig 3. A rat model of myocardial infarction.
Representative M-mode echocardiograms show loss of anterior wall motion and LV dilation (arrows) in post-MI rat hearts, compared to sham controls (A). Representative rat heart shows the presence of a severe anterior LV infarct, compared to sham heart (B). Representative cross-sections of sham and MI rat hearts stained with hematoxylin and eosin (HE) and masson-trichrome (MT) show gross histopathological changes (C). Electron microscopic analyses of rat hearts show the disarrangements of sarcomeres in the infarct regions of the MI rat hearts (D). Sham anterior wall (AW) and posterior wall (PW) of MI show normal fine structure and ordered myofibrils. In contrast, the AW of the MI regions shows the absence of intact myofibrils. The region is filled with inflammatory cells (neutrophils and macrophages). The EM shows detail of the invading cells and large regions of new collagen (*).

