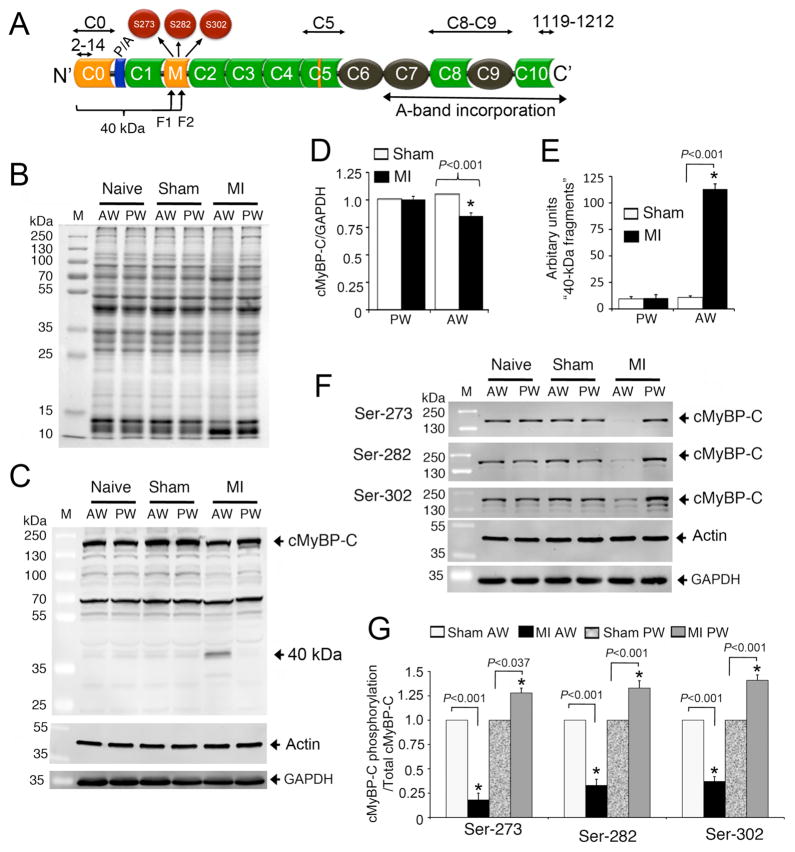
Fig 4. Proteolysis of cMyBP-C post-MI in rat hearts.
A schematic diagram illustrates the cMyBP-C domain structure (A). Immunoglobulin (Ig)-like and fibronectin domains are shown in green and black, respectively. Ig-like C0 and M domains and a 28-residue insertion in C5 domain are specific to cMyBP-C (yellow). Proline-Alanine (P/A)-rich region is shown at the N′-region. The three phosphorylatable serines, S273, S282 and S302, are shown in the M domain. The region of the 40 kDa fragments (fragment 1 (F1) and 2 (F2), Online Supplemental Fig. 6) is shown in which C0 and C1 domains and P/A region are included. The antigenic region of cMyBP-C2–14, C0–C1, C5, C8–C9, and cMyBP-C1119–1212 antibodies that were used in this study are marked. Representative SDS-PAGE analyses of tissue homogenate from naïve, sham and infarct rat hearts show the protein profile of anterior wall (AW) and posterior wall (PW) of MI hearts, compared to naïve and sham controls (B). Ten micrograms of total proteins were resolved on SDS-PAGE, stained in SYPRO RUBY overnight, and scanned on a Typhoon TRIO+ scanner (GE Healthcare, Piscataway, NJ). Representative Western blot analyses of tissue homogenates from naïve, sham and MI rat hearts show the proteolytic pattern of cMyBP-C using rabbit anti-cMyBP-C2–14 antibodies in the AW and PW; Sarcomeric α-actin and GAPDH used as loading controls (C). Data were quantified, and a significant reduction (15±3%) of total cMyBP-C was observed in the AW of MI rat hearts compared to shams (D). Proteolytic release of the 40 kDa N-terminal fragment in the AW of MI rat hearts was significantly higher than controls (E). Phosphorylation levels of Ser-273, Ser-282 and Ser-302 were determined in naïve, sham and MI rat heart tissue by Western blots using site-specific phospho antibodies (F); Sarcomeric α-actin and GAPDH were used as loading controls. Data are summarized (G). *P< 0.001, MI (n=6) vs. sham (n=6).

