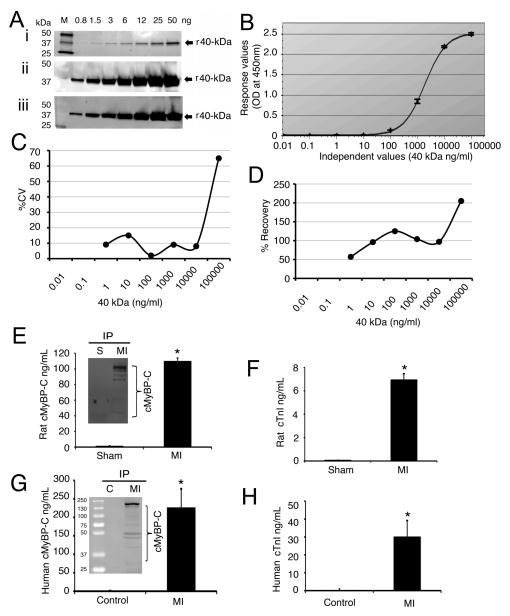
Fig 6. cMyBP-C is released into the circulation post-MI in rats and patients.
To standardize the sandwich ELISA, a sensitivity analysis of both rabbit and mouse N′-specific antibodies was performed (A). Recombinant 40 kDa peptides (F1, residues 1–271) of cMyBP-C were loaded in increasing concentration; SYPRO Ruby-stained gel (i), Western with rabbit polyclonal anti-cMyBP-CC0–C1 antibody (ii) and mouse monoclonal anti-cMyBP-CC0 antibody (iii). A calibration curve of the sandwich ELISA assay is shown (B) to demonstrate absorbance and accuracy of the assay (average mean value of n=3). Corresponding plot of % CV vs. 40 kDa concentration (C). Plot of percentage calibrator recovery vs. 40 kDa concentration (D). Plasma levels of cMyBP-C in sham and MI rats by sandwich ELISA (E). Insert is an IP assay of sham and MI rat plasma. Plasma levels of cTnI in sham and MI rats (F). *P< 0.001, MI (n=11) vs. sham (n=7). Plasma levels of cMyBP-C in human controls and patients with MI (G). Insert shows the presence of cMyBP-C by IP assay. Plasma levels of human cTnI in control and patients with MI (H). *P< 0.001, control (n=11) vs. patients (n=15).

