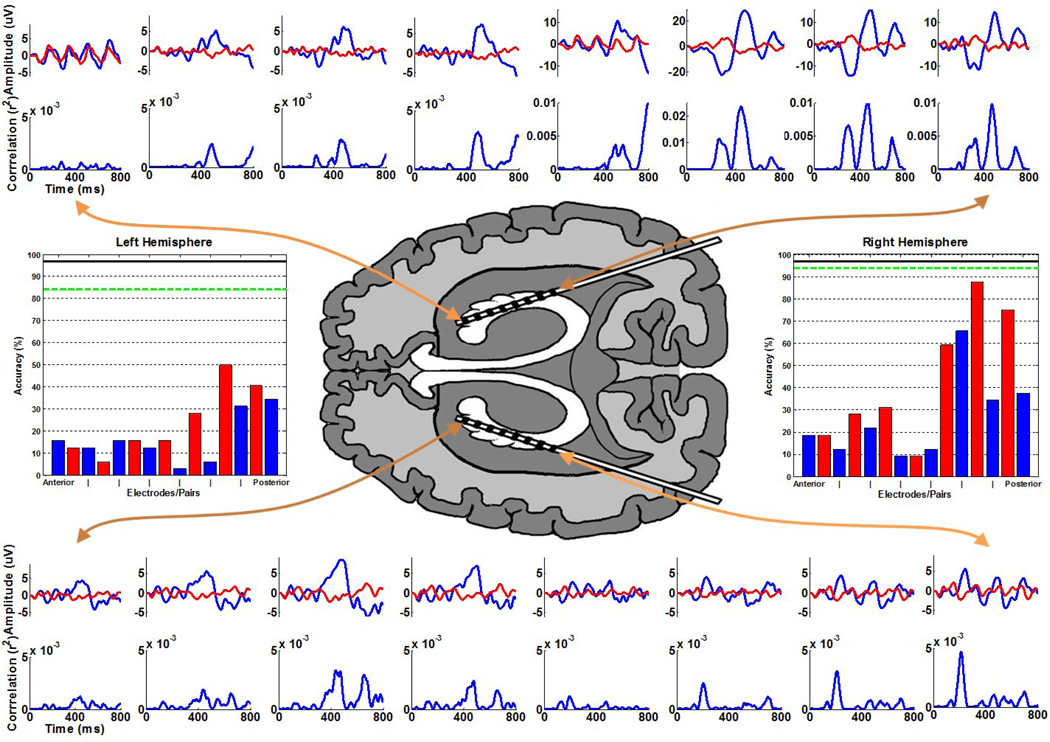
Fig. 2.
The ERPs and the respective r2 correlations with the task are plotted in the periphery, ordered corresponding to the provided axial viewpoint representing the approximate relative electrode positions (note that for the purposes of the illustration the left hemisphere electrodes are not shown in the ventricle). These waveforms represent the average responses to the target (blue) and non-target (red) stimuli, with 0 ms indicating the stimulus onset. Note that the four most posterior responses in the right hemisphere are plotted on different scales for emphasis. The classification accuracy after 15 flash sequences for subsets of electrodes in the left and right hemispheres is provided in the bar graphs. The blue bars indicate the accuracy using individual common referenced electrodes ordered from anterior to posterior. The intermediate red bars indicate the accuracy using adjacent electrode pairs ordered in the same fashion. The green dashed line indicates the accuracy using all 8 electrodes within a given hemisphere (left: 84.4%, right: 93.8%), and the solid black line indicates the accuracy using all 16 electrodes (96.9%), which also represents the accuracy achieved during the online experiments. Chance accuracy for the task is 2.8%.

