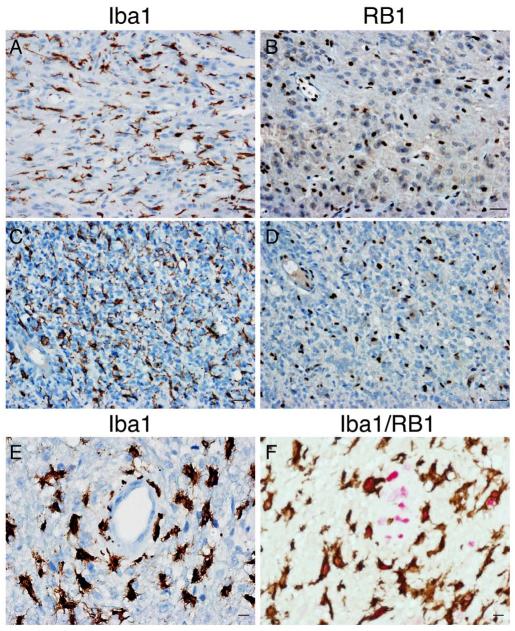
Figure 2.
Assessment of RB1 protein loss in tumor cells. (A-E) Two RB1-immunonegative tumors were either homozygous (A, B) or hemizygous (C, D) deleted for RB1 by fluorescence in situ hybridization. A cut-off value for RB1-positivity of 20% tumor nuclei was used to distinguish RB1-negative tumor cells (B, D) from RB1-positive non-neoplastic elements including endothelial cells and microglia/macrophages (A, C, E; Iba1-positive). Tumor cell nuclei Are generally larger than those of non-neoplastic cells. (F) Double immunostaining for Iba1 (brown) and RB1 (red) highlights RB1-positive microglia/macrophages. Bars: A-D = 30 μm; E, F = 10 μm.

