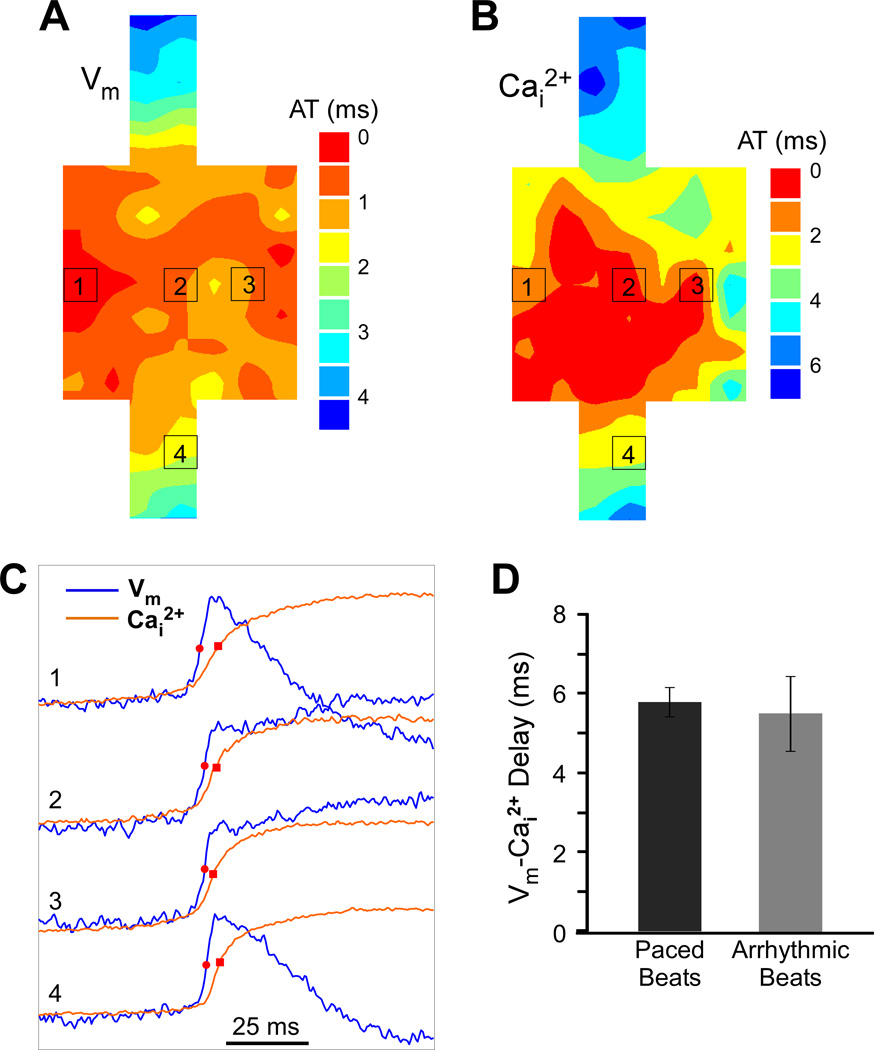
Figure 3.
Relationship between Vm and Cai2+ rises during an arrhythmic beat. A, Isochronal map of activation spread during the arrhythmic beat. AT, activation time. B, Isochronal map of Cai2+ spread during the arrhythmic beat. C, Vm and Cai2+ recordings from selected sites within the expansion region (sites 1–3) and the narrow strand (site 4). D, Comparison of average Vm-Cai2+ delay between arrhythmic and paced beats.

