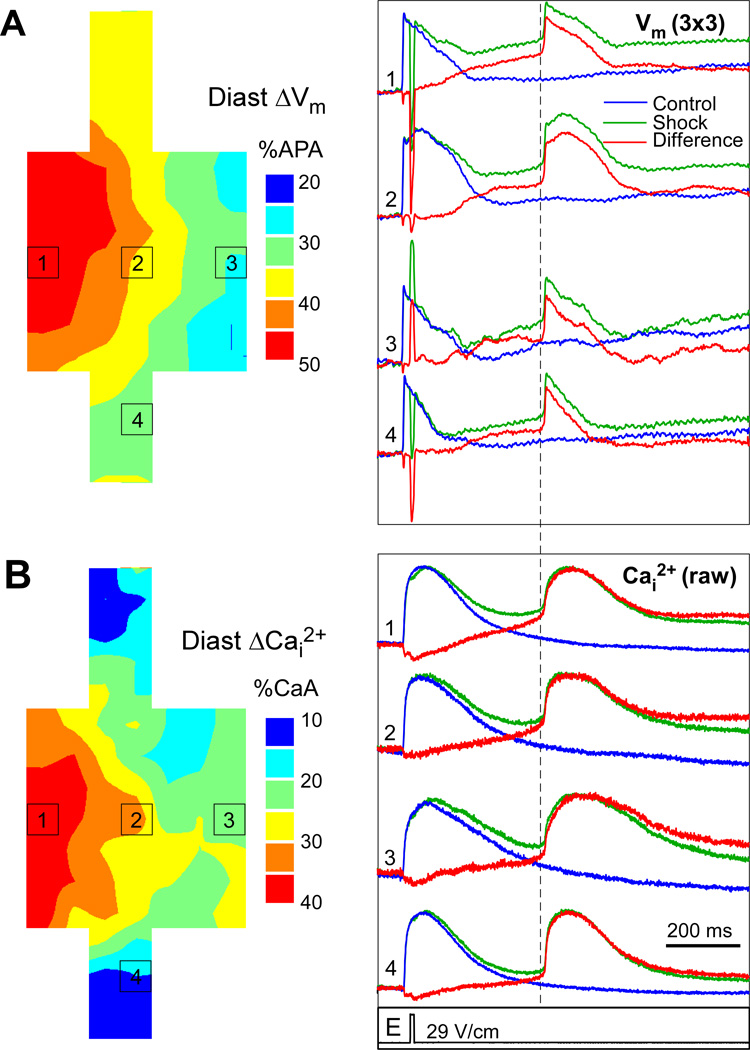
Figure 4.
Post-shock elevation of Vm and Cai2+. A, Isochronal map of diastolic ΔVm and spatially averaged Vm traces from control (blue) and shock (green) recordings, as well as the difference between shock and control (red). B, Isochronal map of diastolic Cai2+ rises and selected raw signals showing control, shock, and difference recordings. The dashed line indicates the measurement point of diastolic levels.

