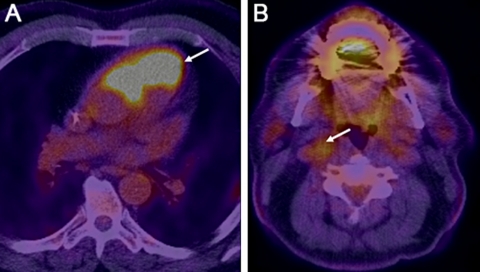
Figure 2.
Paragangliomas revealed by 18F-fluorodeoxyglucose positron emission tomography. (A) Fused positron emission tomography (PET)-CT image of the chest shows a 6.8×3.8 cm hypermetabolic soft tissue mass with max standardised uptake value (SUV) of 39.6 arising anterior to and extending in between aorta and the pulmonary artery/right ventricular outflow tract. (B) Fused PET-CT image of the neck shows a 1.7×1.3 cm hypermetabolic mass with max SUV of 4.2 s playing the right carotid bifurcation. This mass also showed intense contrast enhancement on CT (not shown here).

