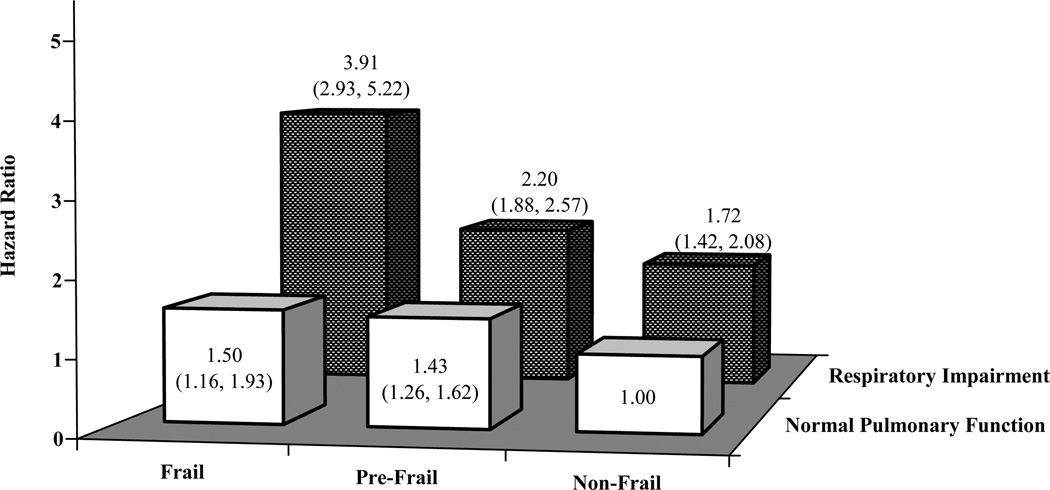
Figure 1.
Adjusted hazard ratios (95% confidence interval) for all-cause mortality, according to baseline frailty status and respiratory impairment (N = 3,471) a
a Single Cox regression model, adjusted for age, height, gender, smoking history, BMI, BMI2, health status, and chronic conditions. The reference group included non-frail participants who had normal pulmonary function. There was a significant interaction between frailty and respiratory impairment (p=.037). The sample size of each subgroup is provided in Table 5.

