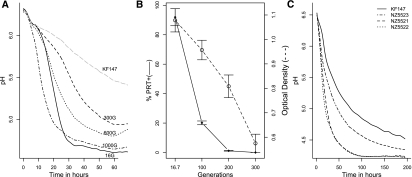
Figure 1.
(A) Acidification of milk by the wild-type strain L. lactis KF 147 (long-dashed gray line) and serial propagation of culture SP1 adapted to milk for 16 (solid line), 300 (dashed line), 600 (dotted line), and 1000 (dash-dot line) generations. Acidification profiles are the average of three biological replicates. Standard deviations of the maximum slopes of each curve (calculated over the consecutive measurements of 3 h) were 3.3%, 1.5%, 2.1%, 8.1%, and 6.6% for cultures KF147, 16, 300, 600, and 1000 generations, respectively. (B) Invasion of protease-negative variants during the first 300 generations in milk. The fraction of protease-positive cells (♦, left y-axis), and the final cell density reached (○, right y-axis), during growth in milk decreased throughout the serial propagation of the cultures (x-axis). The averages of three independently propagated cultures (SP1, SP2, and SP3) and standard deviations are shown. (C) Acidification profiles of the wild-type strain KF147 (solid line) and milk adapted single colony isolates NZ5521 (dashed line), NZ5522 (dotted line), and NZ5523 (dash-dot line) grown in milk.

