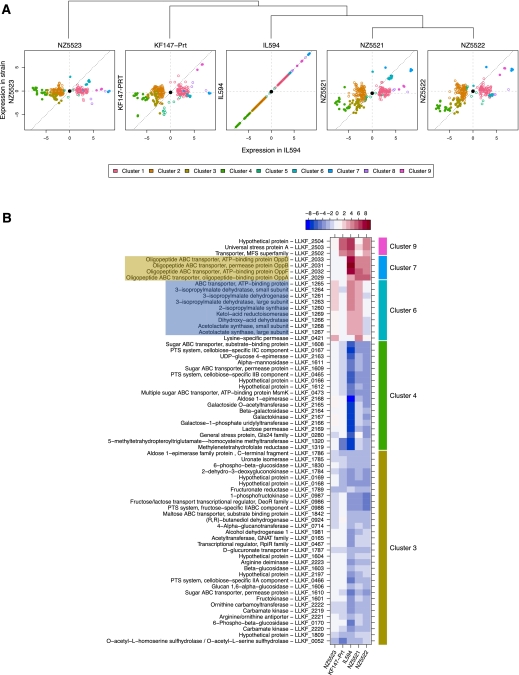
Figure 2.
Genome-wide gene expression profiles during exponential growth in milk. All strains are compared to the wild-type strain KF147, and log2-transformed expression ratios are displayed. (A) Expression levels of all differentially regulated genes compared to KF147 (p < 0.001 in at least one of the strains) in relation to that of the dairy isolate IL594. Genes that are not differentially expressed with respect to strain KF147 map on the center of the plot (•). Expression levels of genes falling either in the bottom left or the top right quadrant show transcript changes toward the levels found in IL594. Genes falling in the top left or bottom right quadrant show changes in the opposite direction compared with IL594. Transcript levels similar to those found in the dairy isolate are identified as dots close to the diagonal of the plot (dotted line). The tree at the top of panel A summarizes the similarity of gene expression between the strains. (B) The differential gene expression in detail for the five most discriminating clusters. Only genes of clusters with an average differential expression of at least fourfold in at least one of the three evolved strains are plotted (corresponding to solid symbols in panel A). Gene functional annotations and identifiers are listed. Brown and blue shading indicates genes/putative operons containing point mutations in the upstream promoter region in at least one of the adapted strains. The heat map on the top of panel B displays the log2-transformed differential expression levels.

