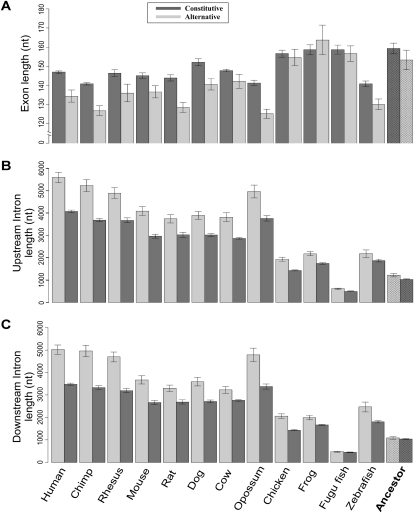
Figure 2.
Length of constitutive and alternative exons and their flanking introns in 12 vertebrate genomes and reconstruction of ancestral length. (A) Mean lengths of alternative (light gray) and constitutive (dark gray) exons. The reconstructed most parsimonious ancestral length is plotted in the right-most column. Error bars represent the standard error of the mean. (B,C) As in A, for the intronic regions upstream of and downstream from alternative and constitutive exons, respectively.

