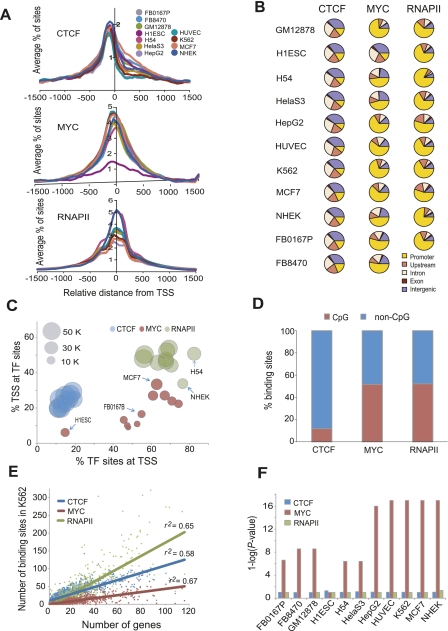
Figure 2.
Occupancy patterns of CTCF, MYC, and RNAPII relative to gene annotations. (A) Average profiles of CTCF, MYC, and RNAPII binding sites within ±1.5 kb from all annotated TSS (Transcription start site, indicated by zero on the x-axis) in 10–11 different cell types. The average percentage of binding sites within ±1.5 kb of the TSS is shown on the y-axis. (B) Pie charts show the distribution of CTCF, MYC, or RNAPII binding sites in five different genomic regions. A promoter is defined as a region within ±2 kb from the TSS of a gene, upstream is between 2 and 20 kb upstream of the TSS, and intergenic is a region excluding a promoter, upstream, intron and exon. (C) The percentage of binding sites of each TF within ±2 kb from a TSS (x-axis) is plotted against the percentage of TSS within ±2 kb from a TF binding site (y-axis). The area of the circles is proportional to the number of binding sites. Some cell types are indicated by arrows. (D) CTCF prefers to bind in non-CpG islands. The y-axis shows the percentage of binding sites in CpG and non-CpG loci for the factors indicated on the x-axis. (E) TF binding sites are positively correlated with gene density. The scatterplot shows the number of genes in each 2 Mb bin across the genome (x-axis) and the number of TF binding sites in each bin (y-axis). The three factors are shown in different colors as indicated. The lines show the linear regression fit for each factor. (F) MYC enrichment in bidirectional promoters. The y-axis shows the enrichment of binding sites in bidirectional promoters calculated as 1-log (P-value) using the hypergeometric distribution, for each of the cell types indicated on the x-axis. A value of 1 on the y-axis represents no enrichment, seen for RNAPII and CTCF.

