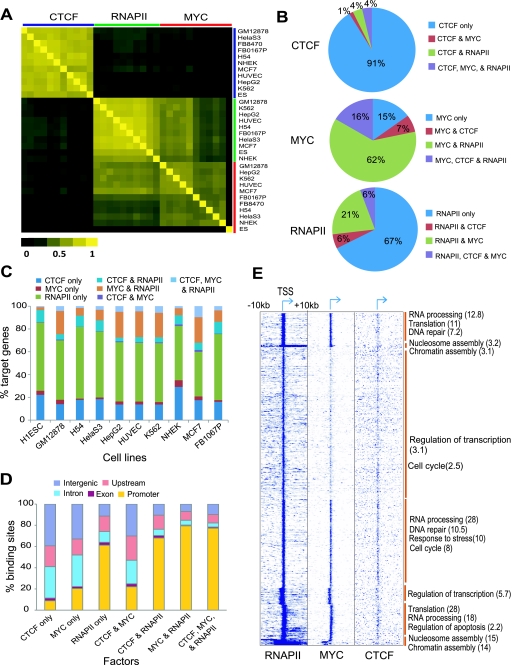
Figure 4.
CTCF, MYC, and RNAPII can regulate their target genes in a combinatorial manner. (A) Heat map of correlations between the target genes of each combination of factor and cell type. The Pearson correlation coefficient was calculated between the set of target genes of each factor and those of other factors in a binary mode (target or non-target). TFs and cell type combinations are arranged in the same order along both axes, as listed on the vertical axis. (B) Proportion of single and combinatorial binding sites of CTCF, MYC, and RNAPII in K562. (C) Proportion of single and combinatorial target genes of the three factors in each cell type. The percentage of target genes in each category is shown on the vertical axis, for each of the cell types shown below. (D) The distribution of single or combinatorial binding sites of the three factors in five different genomic regions. The average percentage of binding sites in each region across all cell lines is shown on the vertical axis, for each of the combinations shown below. (E) Heat map showing gene-wise patterns of TF occupancy in a 20-kb window around the TSS. Data were clustered using K-means clustering. Functional enrichment of genes in indicated functional categories for the groups indicated by a brown vertical bar is shown as the negative log of the P-value in brackets on the right.

