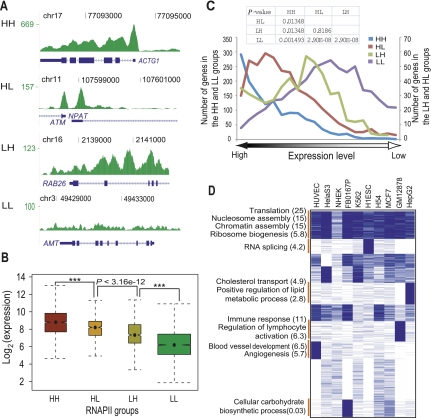
Figure 6.
RNAPII binding regulates gene expression in four distinct binding modes. (A) Wiggle track images show examples of four RNAPII binding groups classified based on its occupancy signal in the promoter and the body of a gene. (HH) High occupancy in both the promoter and the body of a gene; (HL) high occupancy only in the promoter of a gene; (LH) high occupancy only in the body of a gene; (LL) low occupancy signal in the promoter as well as the body of a gene. (B) Notched boxplot shows the distribution of expression level among four classes of RNAPII binding sites in K562 cells. The x-axis represents four different RNAPII binding groups. The y-axis shows log-transformed expression level of corresponding genes. Data for other cell types are shown in Supplemental Figure S17. (C) Distribution of genes of four RNAPII groups in the expression rank map. The x-axis indicates expression ranking from highest (left) to lowest (right). The y-axis represents number of genes in four groups. Two y-axes were used to represent the range of genes in each of the four groups. (D) Gene functional enrichment in cell-type specific as well as ubiquitous RNAPII targets in the HH group. Cell types are shown on top. Binding data were rendered in blue (occupied) and white (not-occupied) and clustered by K-means clustering. The functional annotation program, DAVID (Huang et al. 2007), was used to analyze functional enrichment. Annotated functional groups of each cluster are shown with the negative log of the P-values (Bonferroni corrected) in brackets.

