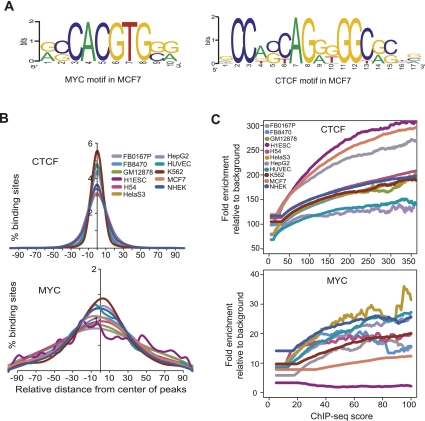
Figure 9.
Motif enrichment in binding sites. (A) Motifs discovered de novo from strong binding sites in MCF7 for CTCF and MYC, using the DME algorithm. (B) Distribution of motifs for CTCF and MYC around the center of individual binding sites for each factor. The plots show the distribution of the canonical motif, discovered de novo from our ChIP-seq data. However, for MYC in H1ES cells, where the canonical motif was not discovered de novo, the plot shows the distribution of the known canonical motif, CACGTG. (C) Relationship of motif enrichment relative to background and the ChIP-seq occupancy score. The plots show the behavior of the canonical motif, discovered de novo from our ChIP-seq data.

